

Pew Research Center’s latest findings, drawn from Wave 190 of the American Trends Panel (ATP), offer a comprehensive look at the rigorous methodology underpinning their nationally representative surveys. Conducted between March 23 and March 29, 2026, this wave engaged 3,507 U.S. adults out of 4,046 individuals sampled, achieving a robust survey-level response rate of 87%. This detailed methodology ensures the reliability and accuracy of the data, providing a solid foundation for understanding public opinion on critical issues. The cumulative response rate, accounting for recruitment and attrition, stands at 3%, with a negligible break-off rate of 1% among those who began the survey. The margin of sampling error for the full sample is a precise plus or minus 1.9 percentage points, reflecting the high quality of the data collection.
A key feature of the ATP’s design is its commitment to accurately representing diverse demographic groups. To achieve this, the survey incorporates an oversample of Muslim, Jewish, and non-Hispanic Asian adults. This deliberate strategy ensures that the opinions and experiences of these often smaller demographic subgroups are captured with greater precision. These oversampled groups are subsequently weighted to accurately reflect their proportion within the broader U.S. adult population, thereby maintaining the overall representativeness of the findings. The survey was administered by SSRS, employing a mixed-mode approach that included online interviews with 3,377 participants and live telephone interviews with 130 individuals, conducted in both English and Spanish.
Panel Recruitment and Evolution
The foundation of the American Trends Panel’s strength lies in its evolving and sophisticated recruitment strategies. Since 2018, the ATP has primarily utilized address-based sampling (ABS) for its recruitment efforts. This method involves mailing study cover letters and pre-incentives to a stratified, random sample of households identified through the U.S. Postal Service’s Computerized Delivery Sequence File. This file is known to cover an extensive 90% to 98% of the U.S. population, ensuring broad reach. Within each selected household, the adult whose birthday is next is invited to participate, a method designed to ensure a random selection within the household. While the specifics of the ABS protocol have undergone adjustments over time, they are available upon request. Prior to 2018, the ATP relied on traditional random-digit-dial (RDD) surveys conducted via landline and cellphone, also in English and Spanish.

The ATP has consistently recruited a national sample of U.S. adults annually since 2014. In certain years, the recruitment process has included targeted oversampling efforts to enhance the precision of data for underrepresented populations. For instance, Hispanic adults were oversampled in 2019, Black adults in 2022, and Asian adults in 2023, demonstrating a proactive approach to capturing the diversity of American perspectives.
Sample Design and Stratification
The target population for this specific survey encompassed all noninstitutionalized individuals aged 18 and older residing in the United States. The sample design for Wave 190 employed a stratified random sample drawn from the ATP. Critically, Muslim, Jewish, and non-Hispanic Asian adults were selected with certainty. This ensures their presence in sufficient numbers for meaningful analysis. The remaining panelists were sampled at rates meticulously calibrated to ensure that the proportion of respondents within each stratum closely mirrored their representation in the overall U.S. adult population. These respondent weights are subsequently adjusted to account for any differential probabilities of selection, a crucial step detailed further in the weighting section.
Questionnaire Development and Rigorous Testing
The integrity of survey data begins with a well-crafted questionnaire. For Wave 190, the questionnaire was meticulously developed by Pew Research Center in close consultation with SSRS. The online survey platform underwent extensive testing by both the SSRS project team and Pew Research Center researchers. This rigorous testing phase spanned both desktop and mobile devices, ensuring a seamless and accurate respondent experience. Furthermore, the SSRS project team populated test data that was then analyzed using SPSS to verify that all logical flows and randomizations within the survey operated precisely as intended before the official launch. This multi-layered testing protocol is a cornerstone of the ATP’s commitment to data quality.
Incentives and Participant Engagement
Recognizing the value of participant time and effort, all ATP respondents are offered a post-paid incentive for their participation. This incentive can be received as a check or as a gift code for major online retailers like Amazon.com, Target.com, or Walmart.com. The incentive amounts, ranging from $5 to $20, are tiered based on the relative difficulty of reaching certain population segments. This differential incentive strategy is specifically designed to encourage participation among groups that historically exhibit lower survey response rates, thereby enhancing the representativeness of the panel.
Data Collection Protocol: A Dual Approach
The data collection period for Wave 190 was scheduled from March 23 to March 29, 2026, utilizing a dual-mode approach to maximize accessibility and response.
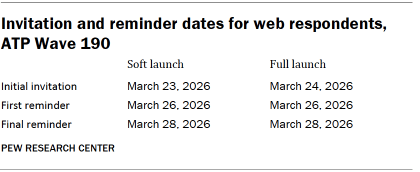
For panelists opting for online participation: Postcard notifications were dispatched to a subset of participants on March 23. The survey invitations were strategically launched in two phases: a soft launch and a full launch. The soft launch, commencing with an initial invitation on March 23, included sixty panelists. All remaining English- and Spanish-speaking sampled online panelists were then included in the full launch, receiving their invitations on March 24. Panelists engaging online were sent an email invitation and received up to two email reminders if they did not initially respond. For those who had consented to SMS notifications, an SMS invitation with a direct link to the survey was sent, accompanied by up to two SMS reminders.
For panelists preferring telephone interviews: Prenotification postcards were mailed on March 20. A soft launch for telephone surveys commenced on March 23, with interviewers dialing until three completed interviews were secured. Subsequently, all remaining English- and Spanish-speaking sampled phone panelists had their numbers dialed throughout the remainder of the field period. To ensure thorough outreach, panelists participating via phone could receive up to six calls from trained SSRS interviewers.
Ensuring Data Integrity: Quality Checks
Pew Research Center employs stringent data quality checks to safeguard the integrity of its findings. During Wave 190, Center researchers meticulously examined the collected data for any patterns indicative of satisficing behavior. This involved identifying respondents who exhibited unusually high rates of leaving questions blank or consistently selecting the first or last option presented in a series. As a direct outcome of these thorough checks, five ATP respondents were excluded from the final survey dataset prior to weighting and analysis, ensuring that the data is as free from systematic bias as possible.
The Crucial Role of Weighting
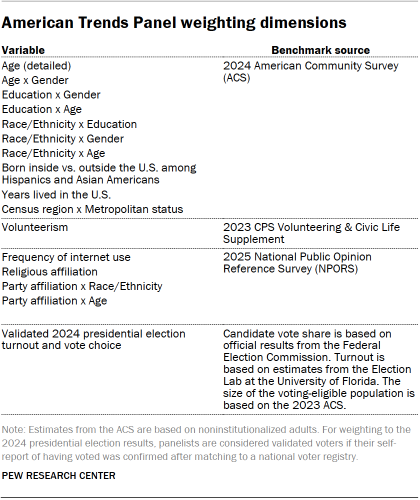
The American Trends Panel data undergoes a sophisticated weighting process designed to meticulously account for multiple stages of sampling and nonresponse that occur throughout the panel survey lifecycle. Initially, each panelist is assigned a base weight reflecting their probability of being recruited into the panel. These base weights are then calibrated to align with specific population benchmarks, as detailed in an accompanying table. This calibration serves to correct for nonresponse during the initial recruitment surveys and for panel attrition over time. In instances where only a subsample of panelists is invited to participate in a particular wave, the weight is further adjusted to reflect any differential selection probabilities associated with that specific wave.
For panelists who successfully complete the survey, the weight is recalibrated once more to align with the population benchmarks. To mitigate potential losses in precision caused by extreme weight variances, these weights are then trimmed at the 1st and 99th percentiles. This comprehensive weighting procedure ensures that the final dataset accurately represents the U.S. adult population, even after accounting for complex sampling and nonresponse issues. Sampling errors and tests for statistical significance are conducted with the understanding of the effect of this weighting.
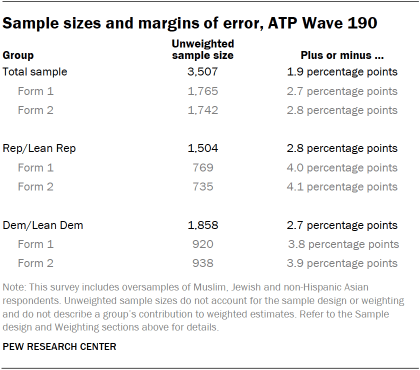
The accompanying table illustrates the unweighted sample sizes and the expected margin of error at a 95% confidence level for various demographic groups within the survey. These figures are crucial for understanding the precision of estimates for different segments of the population.
Sample sizes and sampling errors for additional subgroups are available upon request, underscoring the detailed nature of the ATP’s data reporting. It is also important to acknowledge that beyond sampling error, other factors such as question wording and the practical challenges inherent in survey administration can introduce potential error or bias into the findings of opinion polls.
Dispositions and Response Rates: A Detailed Breakdown
The comprehensive reporting of dispositions and response rates provides transparency into the data collection process. The final dispositions table for ATP Wave 190 offers a granular view of how the sampled individuals were categorized, distinguishing between completed interviews, refusals, and other outcomes. This detailed breakdown is essential for evaluating the overall representativeness and potential sources of bias in the survey.
Similarly, the cumulative response rate table for ATP Wave 190 offers a critical metric for understanding the panel’s ongoing engagement and the cumulative challenges of maintaining a representative sample over time. The high survey-level response rate of 87% for this specific wave is a testament to the effectiveness of the ATP’s recruitment and engagement strategies. However, the cumulative response rate, which accounts for the entire journey from initial recruitment to participation in a given wave, provides a more conservative estimate of panel representativeness. Understanding these distinct response rate metrics is vital for a complete assessment of the survey’s methodological rigor.
The meticulous attention to detail in recruitment, sampling, data collection, quality control, and weighting underscores the Pew Research Center’s unwavering commitment to producing reliable and insightful data. The American Trends Panel, through its continuous evolution and dedication to methodological excellence, remains a cornerstone for understanding the complex and dynamic landscape of American public opinion.


