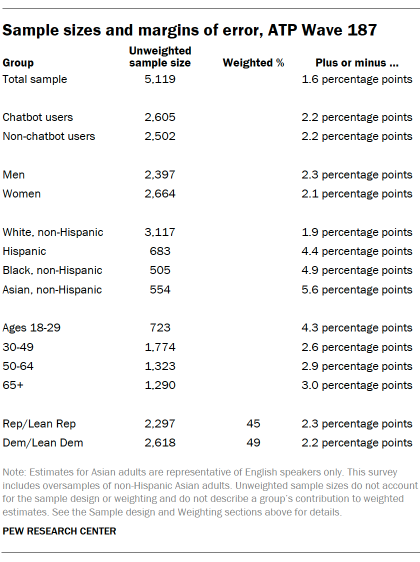
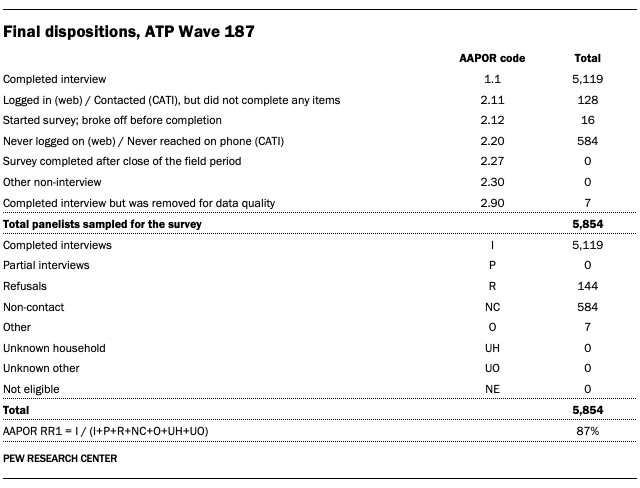
The Pew Research Center’s American Trends Panel (ATP), a cornerstone of its public opinion research, has once again demonstrated its rigorous approach to data collection with Wave 187, conducted from February 17th to February 23rd, 2026. This detailed examination of the ATP’s methodology reveals a sophisticated and multi-faceted process designed to ensure the highest levels of accuracy and representativeness in its findings, particularly when examining nuanced demographic groups. The survey, which garnered responses from 5,119 out of 5,854 sampled panelists, achieved an impressive survey-level response rate of 87%. While the cumulative response rate, accounting for initial recruitment and ongoing panel maintenance, stands at 3%, this figure reflects the long-term commitment to building and sustaining a diverse and engaged panel. The margin of sampling error for the full sample of 5,119 respondents is a precise plus or minus 1.6 percentage points, a testament to the robust statistical design.
One of the key strengths of the ATP’s methodology, highlighted in Wave 187, is its commitment to capturing the perspectives of smaller demographic subgroups. In this instance, an intentional oversample of non-Hispanic Asian adults was implemented. This strategic decision allows for the generation of more precise estimates regarding the opinions and experiences of this often underrepresented population segment. It is crucial to note that these oversampled groups are subsequently weighted back to accurately reflect their proportionate presence within the broader U.S. adult population, thereby maintaining the overall representativeness of the findings.
The operational execution of Wave 187 was managed by SSRS, a reputable survey research firm, employing a dual approach of online interviewing (n=4,930) and live telephone interviewing (n=189). The survey was administered in both English and Spanish, further enhancing its accessibility and comprehensiveness. For those interested in the intricacies of the ATP’s ongoing development, comprehensive information is available through the Pew Research Center’s dedicated resource, "About the American Trends Panel."

Panel Recruitment: A Foundation of Representativeness
The foundation of the ATP’s reliability lies in its meticulous panel recruitment process, which has evolved significantly over the years. Since 2018, the panel has primarily utilized Address-Based Sampling (ABS) for recruitment. This method involves mailing study cover letters and pre-incentives to a stratified, random sample of households selected from the U.S. Postal Service’s Computerized Delivery Sequence File. This file, estimated to cover 90% to 98% of the U.S. population, ensures a broad and unbiased initial reach. Within each sampled household, the adult with the next birthday is identified as the potential participant, employing a neutral selection mechanism. While the specifics of the ABS recruitment protocol have undergone refinements since its inception, the core principle of broad, random household selection remains constant. Prior to 2018, the ATP relied on a combination of landline and cellphone random-digit-dial surveys, also administered in English and Spanish, to build its panel.
The ATP has been engaged in recruiting a national sample of U.S. adults on an approximate annual basis since 2014. Recognizing the importance of capturing diverse viewpoints, certain recruitment years have incorporated additional efforts, known as "oversamples," specifically designed to enhance data accuracy for underrepresented groups. For example, Hispanic adults, Black adults, and Asian adults were targeted with oversampling in 2019, 2022, and 2023, respectively, demonstrating a proactive approach to ensuring demographic inclusivity.
Sample Design: Precision and Proportionality
The sample design for Wave 187 was meticulously crafted to represent noninstitutionalized individuals aged 18 and older residing in the United States. A stratified random sample was drawn from the existing ATP panel, with a specific emphasis on ensuring that non-Hispanic Asian adults were selected with certainty due to their inclusion in the oversample. For the remaining panelists, sampling rates were carefully calibrated to maintain proportionality with their respective shares of the U.S. adult population, achieving the highest degree of representativeness possible. The subsequent application of respondent weights, as detailed in the weighting section, further corrects for any differential probabilities of selection that may have occurred during the sampling process.
Questionnaire Development and Testing: Ensuring Clarity and Accuracy
The integrity of survey data hinges on the quality of the questions asked. For Wave 187, the questionnaire was collaboratively developed by Pew Research Center researchers in close consultation with SSRS. This collaborative approach ensures that questions are not only relevant to the research objectives but are also phrased with clarity and neutrality. The online survey platform underwent rigorous testing by both the SSRS project team and Pew Research Center researchers across a range of devices, including PCs and mobile phones. To further validate the survey’s functionality, the SSRS team populated test data that was meticulously analyzed in SPSS. This thorough pre-launch testing aimed to confirm that all logical pathways and randomizations within the survey operated as intended, thereby minimizing potential technical glitches that could compromise data integrity.
Incentives: Fostering Participation
Recognizing the value of panelists’ time and contributions, all respondents for Wave 187 were offered a post-paid incentive for their participation. This incentive provided flexibility, allowing respondents to choose between a check or a digital gift code redeemable at major online retailers like Amazon.com, Target.com, or Walmart.com. The incentive amounts varied, ranging from $5 to $15, with differential amounts strategically applied to reach populations that traditionally exhibit lower survey response propensities. This tiered incentive structure is a deliberate strategy to enhance panel survey participation rates among all demographic groups, ensuring broader and more equitable engagement.
Data Collection Protocol: A Multi-Channel Approach
The data collection for Wave 187 spanned a defined field period from February 17th to February 23rd, 2026. The survey was administered through two primary channels: self-administered web surveys and live telephone interviews.
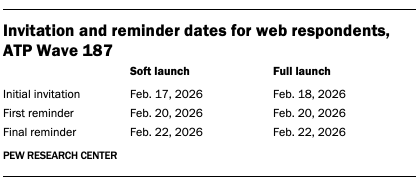
For panelists opting for the online survey, a multi-stage invitation process was employed. Postcard notifications were dispatched to a subset of panelists on February 17th. The initial survey invitations were sent out in two distinct phases: a soft launch and a full launch. The soft launch, commencing on February 17th, included approximately sixty panelists to identify and resolve any emergent issues before broader distribution. The full launch, initiated on February 18th, encompassed all remaining English- and Spanish-speaking sampled online panelists. Panelists who did not initially respond to the survey received up to two email reminders. For those who had consented to receive SMS messages, an SMS invitation with a direct link to the survey was sent, followed by up to two SMS reminders.
Panelists who preferred or were assigned to live telephone interviews were also pre-notified. Prenotification postcards were mailed on February 13th. The telephone data collection also began with a soft launch on February 17th, involving dedicated dialing until a total of five interviews were completed. Subsequently, the phone numbers of all remaining English- and Spanish-speaking sampled phone panelists were dialed throughout the remainder of the field period. Trained SSRS interviewers made up to six calls to each panelist to secure their participation, reflecting a persistent effort to capture a comprehensive dataset.
Data Quality Checks: Upholding Rigor
Maintaining the highest standards of data quality is paramount for the ATP. Throughout the process, Pew Research Center researchers conducted thorough data quality checks to identify any respondents exhibiting patterns of "satisficing." This involved scrutinizing responses for indicators such as unusually high rates of unanswered questions or consistent selection of the first or last option presented in a series of choices. As a direct outcome of these stringent checks, seven ATP respondents were excluded from the survey dataset prior to the weighting and analysis phases, ensuring that the final findings are based on engaged and thoughtful participation.
Weighting: Balancing the Scales of Representation
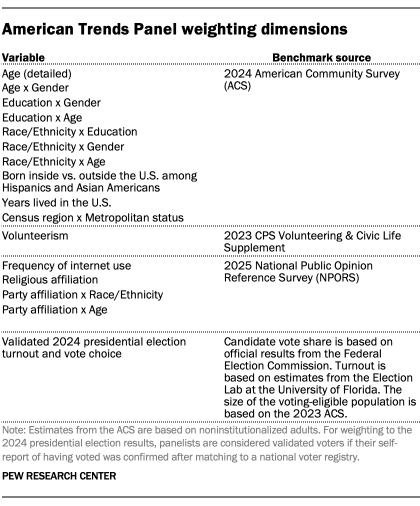
The weighting process for ATP data is a complex, multi-stage procedure designed to account for various sampling and nonresponse stages inherent in panel survey operations. Initially, each panelist is assigned a "base weight," which reflects their probability of being recruited into the panel. These base weights are then calibrated to align with established population benchmarks, as detailed in accompanying tables. This calibration step is crucial for correcting nonresponse that occurs during the recruitment surveys and for addressing panel attrition over time. If a particular wave of the survey involves inviting only a subsample of panelists, the weights are further adjusted to account for any differential probabilities of selection within that subsample.
Upon completion of the survey, the weights are recalibrated once more to align with population benchmarks. To mitigate the potential loss of precision that can arise from extreme weight values, weights are trimmed at the 1st and 99th percentiles. This rigorous weighting methodology ensures that the final analytical dataset accurately reflects the demographic composition and characteristics of the U.S. adult population, thereby enhancing the generalizability of the survey findings. Sampling errors and statistical significance tests are conducted with full consideration of the impact of this weighting procedure.
The accompanying tables provide critical information regarding unweighted sample sizes and the expected sampling error at a 95% confidence level for various demographic groups within the survey. For subgroups not explicitly listed, sample sizes and sampling errors are available upon request, underscoring the transparency and accessibility of the ATP’s methodological documentation. It is also important to acknowledge that, in addition to sampling error, potential biases can be introduced through factors such as question wording and practical challenges encountered during survey administration.
Dispositions and Response Rates: A Snapshot of Engagement
The detailed breakdown of dispositions and response rates for ATP Wave 187 offers a transparent view of the survey’s engagement metrics. The final disposition table illustrates the flow of sampled individuals through the various stages of the survey process, from initial contact to completed interview or non-completion. The cumulative response rate, a key indicator of overall panel health and survey efficiency, is presented separately, providing a comprehensive overview of the panel’s ability to engage and retain participants over time. These figures are essential for understanding the robustness of the data and for contextualizing the survey’s findings within the broader landscape of public opinion research.
Calculating Family Income Tiers: A Nuanced Approach
The methodology for calculating family income tiers within the ATP is designed to provide a more accurate reflection of financial well-being by accounting for variations in household size and geographic cost-of-living differences. Panelists are assigned to income tiers based on a comparative analysis of their adjusted family income against the median adjusted family income of all ATP members. This process involves several steps:
-
Adjustment for Household Size: Family income is first adjusted to account for the number of individuals within the household. This ensures that larger families are not disproportionately penalized or advantaged compared to smaller ones when assessing financial standing.
-
Adjustment for Geographic Cost of Living: A crucial step involves adjusting income based on the cost of living in the respondent’s geographic area. This recognizes that the purchasing power of a dollar varies significantly across different regions of the United States. For instance, the Pine Bluff metropolitan area in Arkansas is identified as a relatively inexpensive region, with a price level 19.7% lower than the national average. Conversely, the San Francisco-Oakland-Berkeley metropolitan area in California is one of the most expensive, with a price level 18.2% higher than the national average. By applying these adjustments, a family earning $40,200 in Pine Bluff would be considered financially equivalent to a family of the same size earning $59,100 in San Francisco, providing a more equitable basis for income comparisons.
-
Tiers Based on Median Adjusted Income: Once incomes are adjusted for both household size and geographic cost of living, they are then compared to the median adjusted family income of all ATP members. Panelists are then assigned to income tiers (e.g., lower, middle, upper) based on their position relative to this median. This tiered approach allows for a more granular analysis of how different income strata perceive and experience various societal issues, moving beyond simple dollar figures to a more nuanced understanding of financial realities.
This detailed and multi-layered approach to survey methodology underscores the Pew Research Center’s unwavering commitment to producing high-quality, reliable, and representative data that informs public discourse and policy. The rigorous standards applied in panel recruitment, sample design, questionnaire development, data collection, quality control, and weighting collectively ensure that the findings from the American Trends Panel are a trusted resource for understanding the American public.