

As the United States approaches its 250th anniversary in July 2026, a retrospective look at the nation’s trajectory over the past half-century reveals a society profoundly reshaped since its bicentennial celebration on July 4, 1976. This period has been marked by significant demographic shifts, evolving economic landscapes, and transformations in family structures, painting a complex portrait of a nation in constant flux. Based on extensive analysis of U.S. Census Bureau data from 1970 to 2024, a picture emerges of a more diverse, older, and less traditionally structured America.
The nation’s last major anniversary milestone, the bicentennial, was a moment of national pride and reflection, celebrating two centuries of independence. However, the subsequent fifty years have witnessed changes that have fundamentally altered the fabric of American society, often in ways that were difficult to predict. These shifts have implications for everything from social policy and economic planning to the very definition of American identity.
A Nation Growing Older and More Diverse
One of the most striking transformations is the aging of the U.S. population. The percentage of Americans aged 65 and older has nearly doubled since 1970, rising from approximately 10% to 18% of the total population. This demographic shift is a global phenomenon, driven by increased life expectancies and declining birth rates, and it presents both opportunities and challenges for healthcare systems, social security programs, and the labor market. The median age has also increased across all racial and ethnic groups, with White and Black Americans experiencing particularly sharp rises.

Alongside this aging trend, the United States has become significantly more racially and ethnically diverse. The proportion of the population identifying as White and non-Hispanic has steadily declined since 1970. Concurrently, the Hispanic population has seen a dramatic surge, more than quadrupling its share of the total. This diversification is also reflected in immigration patterns; over the past five decades, more than 70 million immigrants have arrived in the U.S., leading to a more than threefold increase in the percentage of foreign-born individuals in the population, reaching 14.8% in 2024. This growing diversity is most pronounced in the Southern and Western states, which have experienced significant population migration.
The Shifting American Landscape: Demographics in Detail
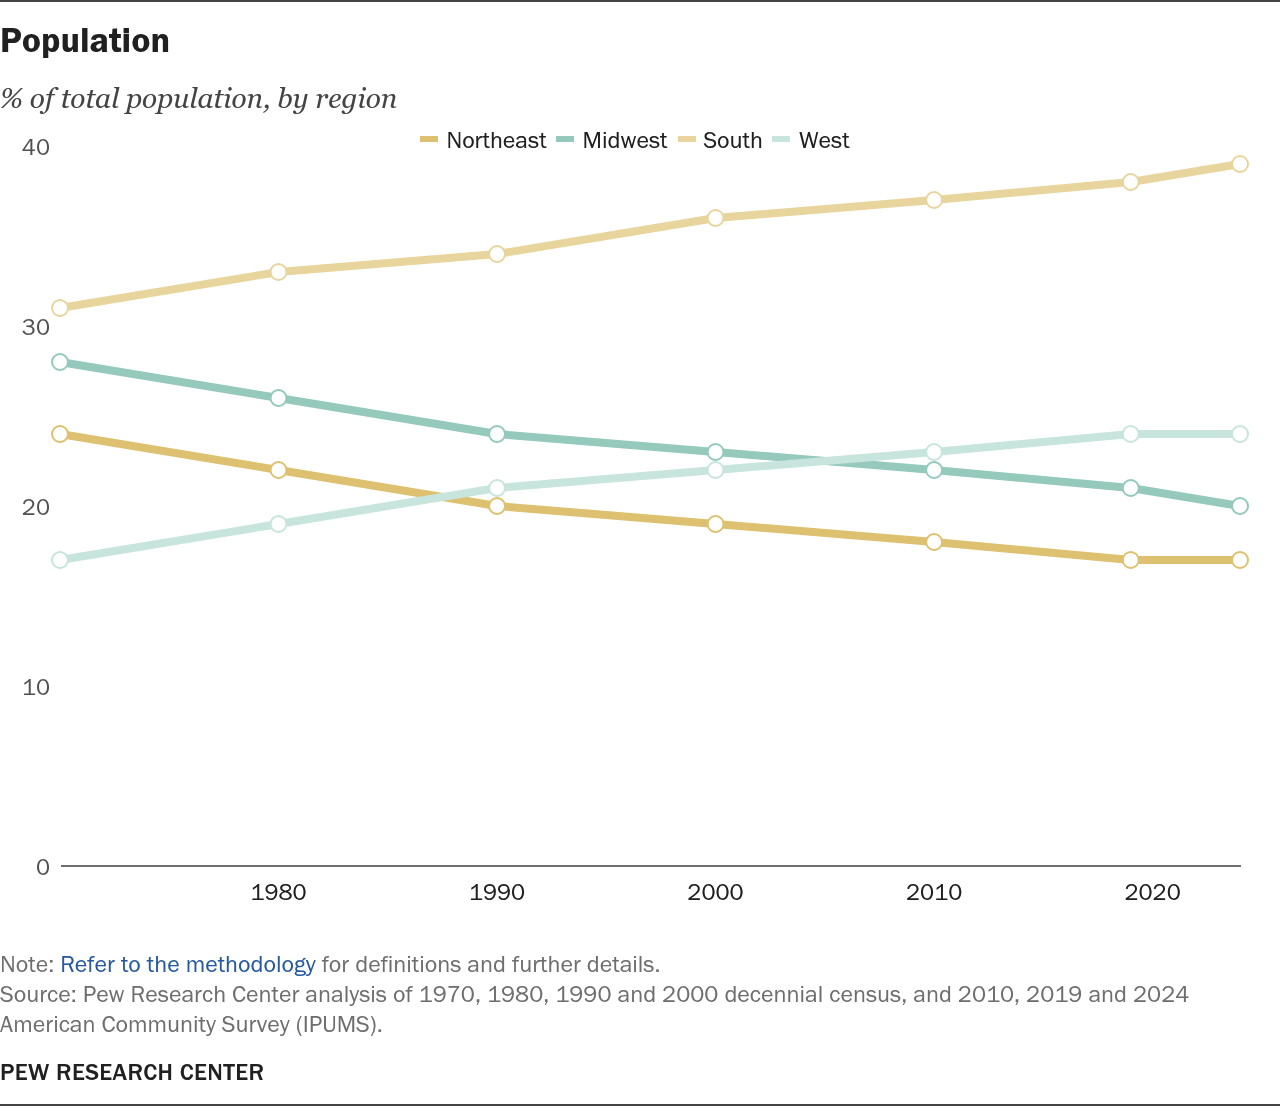
The U.S. population has expanded by over 120 million people in the last fifty years, reaching an estimated 340 million. This growth is a confluence of factors including increased immigration, longer lifespans, and the increasing contributions of Asian and Hispanic Americans to the demographic makeup. Geographically, a pronounced trend has been the migration of Americans towards the Sunbelt states, encompassing the South and the West. In 1970, less than half of the U.S. population resided in these regions (31% in the South and 17% in the West). By 2024, this figure has climbed to over six-in-ten Americans, indicating a significant westward and southward demographic shift.
The increasing foreign-born population is particularly notable. Since 1970, when the foreign-born share stood at a historic low of 4.7%, it has more than tripled to 14.8% in 2024. This growth is disproportionately concentrated among Asian and Hispanic immigrants, and these populations are most heavily represented in the Western and Northeastern regions of the United States.
A Reimagined Workforce and Economy
The American economy has transitioned from a predominantly industrial base to one increasingly driven by services and information. This evolution has reshaped the workforce, with a notable expansion in higher education attainment. Since 1970, the proportion of adults holding at least a bachelor’s degree has more than tripled, rising from 11% to 37%. This educational surge has been more pronounced among women than men, reflecting broader societal shifts.
Women have played a pivotal role in remaking the American workforce. Their labor force participation has increased significantly, contributing to overall workforce growth. In contrast, men’s labor force participation has seen a modest decline over the same period. This shift reflects increased opportunities for women outside the home, driven by changing social norms and greater access to education and professional roles.
While overall earnings for the typical worker have risen when adjusted for inflation, the distribution of these gains has been uneven. Workers with at least a bachelor’s degree have seen the most substantial economic benefits, while those with less formal education have experienced more limited growth. This has contributed to a widening of economic disparities.
The economic landscape has also seen a contraction of the middle class. Since 1970, the percentage of adults classified as middle income has decreased, while the shares in both the lower-income and upper-income tiers have grown. By 2024, 30% of adults fall into the lower-income bracket, compared to 26% in 1970, and the upper-income tier has grown from 14% to 18%. The middle-income bracket has shrunk from 59% in 1970 to 52% in 2024.
Despite an overall increase in economic output, the share of Americans living in poverty has seen a modest decline. This reduction has been particularly significant among older Americans, a testament to the impact of social safety nets and increased retirement savings. However, adults who have not completed a college degree remain substantially more likely to experience poverty than their college-educated counterparts, highlighting persistent economic stratification. Homeownership rates have seen only marginal gains overall since 1970. While rates for those aged 65 and older have expanded significantly, they have slightly decreased for adults aged 18 to 64, reflecting varying economic realities across age cohorts.
Evolving Family Structures and Relationships
The concept and structure of the American family have undergone a profound transformation over the last fifty years. Americans are marrying and having children at later ages, and fewer individuals are marrying or having children at all. These trends have led to significant shifts in living arrangements.

The decline in marriage rates is a prominent feature of this era. In 1970, 69% of adults were married; by 2024, this figure has dropped to 50%. This decline has been more pronounced among adults without a four-year college degree, underscoring the intersection of economic status and marital trends.
Fertility rates have also decreased. The average number of children born to women aged 40 to 44 has fallen from approximately three children fifty years ago to around two children since 1990. This decline is attributed to factors such as the widespread availability of contraception, later marriages, and increased female participation in the workforce.
The traditional nuclear family structure is less prevalent. A smaller proportion of children today live with two married parents compared to fifty years ago. This trend has been observed across most racial and ethnic groups, with the exception of households headed by Asian adults, where the proportion has remained relatively stable.

Conversely, there has been a notable increase in multigenerational households, where more than one adult generation resides under the same roof. This trend is particularly pronounced among Black, Hispanic, and Asian Americans, with nearly 30% living in such arrangements by 2024. For White Americans, the figure has risen to 16%. This resurgence of multigenerational living may be influenced by economic factors, cultural preferences, and the need for elder care.
Broader Implications and Future Outlook
The demographic, economic, and social changes observed over the past fifty years paint a picture of a dynamic and evolving nation. The increasing diversity of the United States presents opportunities for cultural enrichment and innovation, but also necessitates ongoing efforts to ensure social cohesion and equity. The aging population will require adaptive social policies and economic strategies. The widening economic gaps underscore the persistent challenge of ensuring shared prosperity.
As the nation stands on the cusp of its 250th anniversary, these trends offer critical insights into the challenges and opportunities that lie ahead. Understanding these transformations is vital for shaping policies and fostering a society that reflects the aspirations and realities of its diverse populace. The Pew Research Center’s analysis provides a data-driven foundation for this ongoing national conversation, highlighting both the progress made and the enduring complexities of the American experiment.

The data presented, drawing from the U.S. Census Bureau’s decennial censuses and American Community Surveys, provides a robust statistical backbone to these observations. These comprehensive datasets allow for detailed comparisons over time, revealing the gradual yet significant shifts that have redefined American life. The methodology, which focuses on data collected from 1970 onwards, acknowledges the limitations of earlier historical data collection but provides a clear and consistent lens through which to view the nation’s recent past and its present trajectory. The comprehensive nature of this research allows for a nuanced understanding of how the United States has transformed since its bicentennial, offering a vital perspective as it prepares to mark its quarter-millennial milestone.


