

Pew Research Center’s rigorous methodology for Wave 190 of the American Trends Panel (ATP) provides a detailed account of how nationally representative data on U.S. adults is collected, ensuring the reliability and accuracy of its findings. This comprehensive survey, conducted from March 23 to March 29, 2026, involved a substantial sample of 3,507 panelists out of 4,046 who were initially contacted, achieving a robust survey-level response rate of 87%. The cumulative response rate, which accounts for initial recruitment and ongoing panel attrition, stands at 3%, reflecting the challenges of maintaining a consistently engaged national panel over time. The margin of sampling error for the full sample is a narrow ±1.9 percentage points, underscoring the precision of the collected data.
A key feature of the ATP methodology is its commitment to providing precise estimates for smaller demographic subgroups. In Wave 190, this was achieved through an intentional oversample of Muslim, Jewish, and non-Hispanic Asian adults. This strategic approach ensures that the opinions and experiences of these often underrepresented groups are captured with greater accuracy, though these groups are subsequently weighted back to their correct proportions in the overall population to maintain national representativeness. The survey was administered by SSRS on behalf of Pew Research Center, utilizing a dual approach of online interviewing for the vast majority of respondents (3,377) and live telephone interviews for a smaller segment (130). This multi-modal data collection ensures accessibility for a wider range of participants, and interviews were conducted in both English and Spanish.
Panel Recruitment: A Foundation of Robust Sampling
The foundation of the American Trends Panel’s reliability lies in its sophisticated recruitment process. Since 2018, the ATP has predominantly employed address-based sampling (ABS) for its recruitment efforts. This method involves mailing a study cover letter, accompanied by a pre-incentive, to a stratified random sample of households selected from the U.S. Postal Service’s Computerized Delivery Sequence File. This file is known to cover an estimated 90% to 98% of the U.S. population, providing a broad reach. Within each sampled household, the adult with the next birthday is identified as the potential participant, a standard method for ensuring random selection within a household. While specific details of the ABS recruitment protocol have evolved since 2018, they are available upon request, demonstrating a commitment to transparency. Prior to 2018, the ATP relied on traditional random-digit-dial surveys conducted via landline and cellphone, also in English and Spanish.

The ATP has consistently recruited a national sample of U.S. adults annually since 2014. Recognizing the importance of diverse perspectives, some recruitment years have incorporated targeted oversampling efforts to bolster the representation of specific demographic groups. For instance, Hispanic adults were oversampled in 2019, Black adults in 2022, and Asian adults in 2023, each time with the goal of enhancing the accuracy of data pertaining to these communities. This history of adaptive recruitment strategies highlights the panel’s ongoing efforts to reflect the evolving demographic landscape of the United States.
Sample Design: Precision and Proportionality
The sample design for Wave 190 was meticulously crafted to ensure that the collected data accurately represents the target population: noninstitutionalized individuals aged 18 and older residing in the United States. The survey utilized a stratified random sample drawn from the existing ATP membership. A critical aspect of this design was the "selected with certainty" inclusion of Muslim, Jewish, and non-Hispanic Asian adults. This means these groups were guaranteed a presence in the sample, irrespective of random chance, to achieve the desired oversampling for detailed analysis.
For the remaining panelists, sampling rates were carefully calibrated to ensure that the proportion of respondents from each stratum within the sample mirrored, as closely as possible, their proportion within the broader U.S. adult population. This proportional allocation is a fundamental principle of representative survey design. Following data collection, respondent weights are adjusted to compensate for any differential probabilities of selection that may have occurred during the sampling process. This weighting procedure, detailed further in its own section, is crucial for correcting any imbalances and ensuring the final data accurately reflects the nation’s demographics.
Questionnaire Development and Testing: Ensuring Clarity and Accuracy
The integrity of survey data begins with the quality of the questions asked. The questionnaire for Wave 190 was a collaborative effort, developed by Pew Research Center in close consultation with SSRS, the firm responsible for data collection. This partnership ensures that the questionnaire is not only relevant to the research objectives but also adheres to best practices in survey design.
Before deployment, the web program used for online respondents underwent rigorous testing. The SSRS project team and Pew Research Center researchers meticulously examined the program’s functionality on both personal computers and mobile devices, recognizing the diverse technological platforms used by participants. This testing phase also included populating test data within the survey logic and randomizations. The analysis of this test data in SPSS was essential to confirm that all survey elements were functioning as intended, preventing potential errors or biases that could arise from technical glitches before the live survey commenced. This thorough pre-launch vetting process is a testament to the commitment to data quality.
Incentives: Encouraging Participation and Equity
To foster participation and acknowledge the valuable time and effort of its panelists, the ATP provides post-paid incentives. For Wave 190, respondents were offered a choice between receiving their incentive as a check or as a digital gift code redeemable at major online retailers such as Amazon.com, Target.com, or Walmart.com. The incentive amounts varied, ranging from $5 to $20. This differential incentive structure was strategically designed to encourage participation from groups that are traditionally harder to reach or exhibit lower survey response propensities. By offering a higher incentive to these harder-to-reach segments, the ATP aims to achieve a more balanced and representative sample, mitigating potential biases that could arise from systematic nonparticipation. This approach reflects a nuanced understanding of the factors influencing survey engagement.
Data Collection Protocol: A Multi-Faceted Approach
The data collection for Wave 190 took place over a concentrated period, from March 23 to March 29, 2026. The survey was administered through two primary channels: a self-administered web survey and live telephone interviewing. This dual approach caters to different participant preferences and technological access.
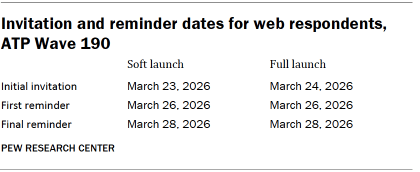
For panelists participating online, a carefully orchestrated communication strategy was employed. Postcard notifications were mailed to a select subset of panelists on March 23, serving as an initial heads-up. The survey invitations themselves were disseminated in two phases: a soft launch and a full launch. The soft launch, beginning on March 23, involved an initial invitation to sixty carefully selected panelists. This controlled rollout allows for a final check of the survey’s functionality and response patterns before broader distribution. Subsequently, on March 24, all remaining English- and Spanish-speaking sampled online panelists received their survey invitations as part of the full launch.
Communication with online panelists continued beyond the initial invitation. Those who did not respond were sent up to two email reminders to encourage completion. Furthermore, for ATP panelists who had previously consented to receive SMS messages, an SMS invitation containing a direct link to the survey was sent, also accompanied by up to two SMS reminders. This multi-channel reminder system maximizes the chances of engagement.
The protocol for telephone participants also involved a structured approach. Prenotification postcards were dispatched on March 20, alerting these panelists to the upcoming survey. A soft launch for phone surveys commenced on March 23, with interviewers dialing until a total of three completed interviews were secured. This initial phase allows for fine-tuning of the telephone interviewing process. Following the soft launch, numbers for all remaining English- and Spanish-speaking sampled phone panelists were dialed throughout the remainder of the field period. To ensure comprehensive outreach, panelists opting for telephone surveys could receive up to six calls from trained SSRS interviewers, a practice designed to maximize the chances of connecting with potential respondents.
Data Quality Checks: Upholding Integrity
Ensuring the accuracy and validity of survey data is paramount. Pew Research Center researchers implemented robust data quality checks to identify and address any potential issues stemming from respondent behavior. A primary focus of these checks was to detect patterns of "satisficing," a phenomenon where respondents provide minimally acceptable answers rather than fully engaging with the survey questions. This included scrutinizing whether respondents exhibited unusually high rates of leaving questions blank or consistently selected the first or last answer option presented, which can indicate a lack of genuine engagement. As a direct outcome of these diligent checks, five ATP respondents were removed from the survey dataset before the weighting and analysis stages. This proactive measure safeguards the integrity of the findings by excluding data that may not accurately reflect genuine opinions.
Weighting: Correcting for Imbalances and Nonresponse
The American Trends Panel data undergoes a comprehensive weighting process designed to correct for various stages of sampling and nonresponse that occur throughout the panel survey lifecycle. Initially, each panelist is assigned a base weight that reflects their probability of being recruited into the panel. These base weights are then calibrated to align with established population benchmarks, a process that helps to correct for nonresponse that occurred during the initial recruitment surveys and subsequent panel attrition.
If only a subset of the panel is invited to participate in a particular wave, the weight is further adjusted to account for any differential probabilities of selection among those invited. This ensures that even when only a portion of the panel is surveyed, the resulting sample remains representative.
Crucially, among the panelists who successfully completed the survey, the weights are calibrated a second time to align with population benchmarks. This recalibration ensures that the final dataset accurately reflects the demographic composition of the U.S. adult population. To mitigate the potential loss of precision that can arise from extreme weight values, the weights are trimmed at the 1st and 99th percentiles. This trimming process helps to stabilize the weights and improve the overall efficiency of the analysis. All calculations of sampling errors and tests of statistical significance take into account the impact of this intricate weighting procedure, providing a more accurate representation of the data’s uncertainty.
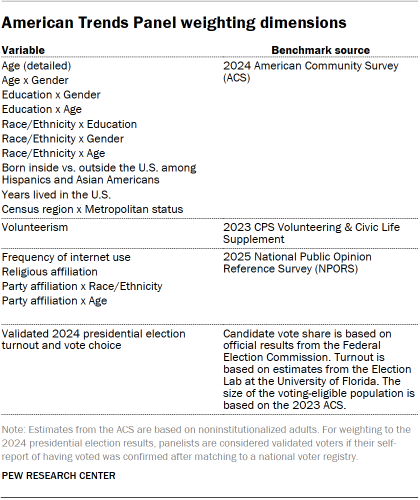
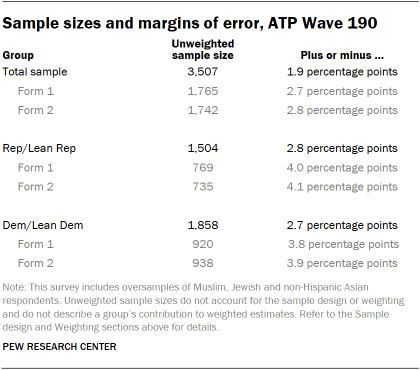
The accompanying tables provide critical insights into the weighting dimensions and the sample sizes and margins of error for various demographic groups. These tables serve as essential references for understanding the statistical foundation of the survey’s findings. For instance, the "American Trends Panel Weighting Dimensions" table illustrates the demographic categories used to calibrate the weights, ensuring alignment with national population figures for characteristics such as age, race, ethnicity, education, and geographic region. The "Sample Sizes and Margins of Error" table is indispensable for researchers and readers alike, as it details the unweighted sample sizes for key subgroups and the associated sampling error at a 95% confidence level. This transparency allows for a clear understanding of the precision of estimates for different segments of the population. For example, the overall sample of 3,507 respondents has a margin of error of ±1.9 percentage points, but for smaller subgroups, the margin of error will naturally be larger due to the reduced sample size. This information is vital for interpreting the findings and understanding the limitations of the data. Sample sizes and sampling errors for additional subgroups not explicitly listed are available upon request, further demonstrating the ATP’s commitment to providing comprehensive data transparency.
Dispositions and Response Rates: Measuring Engagement
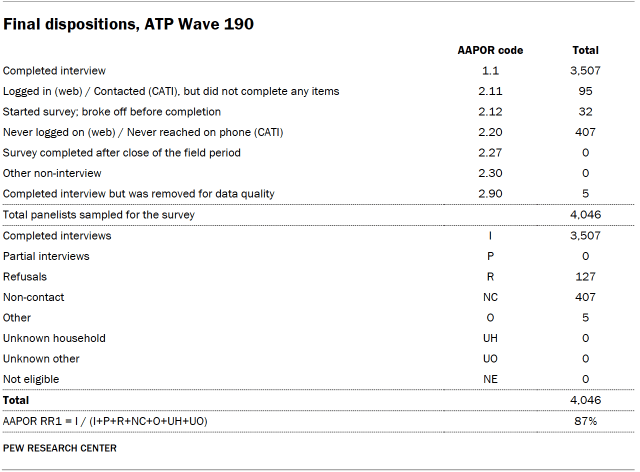
The tables detailing "Final Dispositions" and "Cumulative Response Rate" for ATP Wave 190 offer a granular view of the survey’s operational outcomes. The disposition table breaks down the contacted sample into various categories, such as completed interviews, refusals, and ineligibles. This level of detail is crucial for understanding the dynamics of the data collection process and the proportion of the initial sample that successfully contributed to the final dataset. The "Cumulative Response Rate" table provides an aggregated view of the panel’s overall engagement across multiple stages, from initial recruitment to the specific wave of the survey. A high survey-level response rate, such as the 87% achieved in Wave 190, is a strong indicator of the effectiveness of the data collection protocols and the willingness of panelists to participate in ongoing research. However, the cumulative response rate, which reflects the entire journey of a panelist from recruitment to participation in a specific survey, offers a more comprehensive picture of panel health and sustainability. The reported cumulative rate of 3%, while seemingly low, is typical for long-standing panels that involve multiple recruitment waves and account for attrition over extended periods. It underscores the continuous effort required to maintain a representative and engaged panel.
In addition to the inherent sampling error, it is crucial to acknowledge that other factors can introduce error or bias into the findings of opinion polls. These include the specific wording of questions, which can influence how respondents interpret and answer them, as well as practical difficulties encountered during the survey process. The ATP’s methodological rigor, encompassing careful questionnaire design, robust sampling, comprehensive data quality checks, and sophisticated weighting, is designed to minimize these potential sources of error, thereby maximizing the accuracy and reliability of its research.


