Pew Research Center’s Commitment to Rigorous Data Collection in Wave 196 of the American Trends Panel
In an era where public opinion data is crucial for understanding societal shifts and informing policy, the methodology behind its collection becomes paramount. Pew Research Center’s American Trends Panel (ATP), a cornerstone of their extensive research, recently concluded Wave 196, conducted from July 6 to July 12, 2026. This comprehensive survey, involving 3,554 U.S. adult respondents out of a sampled 4,173, achieved a robust survey-level response rate of 85%. The detailed methodology employed in this wave underscores Pew Research Center’s unwavering dedication to producing reliable, nationally representative data.
Overview of Wave 196: Ensuring Broad and Accurate Representation
Wave 196 of the ATP represents a significant undertaking in capturing the pulse of the American populace. The survey’s design prioritized inclusivity and accuracy, particularly for demographic groups that are often underrepresented in national surveys. This commitment is reflected in the strategic use of oversampling for non-Hispanic Asian adults, 18- to 29-year-old validated voters, and Hispanic validated voters. These targeted efforts ensure that the opinions and experiences of these crucial subgroups are captured with greater precision, allowing for more nuanced analysis. It is critical to note that these oversampled groups are subsequently weighted back to their accurate proportions within the broader U.S. adult population, maintaining the overall representativeness of the findings.
The data collection for Wave 196 was a hybrid operation, conducted by SSRS for Pew Research Center. This involved both online interviews with 3,428 panelists and live telephone interviews with 126 participants. The flexibility in interview modes—English and Spanish—further enhanced accessibility and ensured a broader spectrum of the adult population could participate.
While the survey-level response rate of 85% is highly commendable, the cumulative response rate, accounting for initial recruitment nonresponse and ongoing panel attrition, stands at 3%. This figure, while appearing low, is a standard metric for long-term panel studies and reflects the cumulative challenges of maintaining a panel over time. The break-off rate among those who logged into the survey and completed at least one item was a mere 1%, indicating high engagement once panelists began the survey. The margin of sampling error for the full sample of 3,554 respondents is plus or minus 1.9 percentage points at the 95% confidence level, a standard measure of the statistical precision of the survey results.
Panel Recruitment: A Decade of Evolving Best Practices
The foundation of the ATP’s reliability lies in its sophisticated panel recruitment process, which has evolved significantly since its inception. Since 2018, the panel has primarily utilized address-based sampling (ABS) for recruitment. This method involves mailing a cover letter and a pre-incentive to a stratified, random sample of U.S. households selected from the U.S. Postal Service’s Computerized Delivery Sequence File, a file estimated to cover 90% to 98% of the nation’s population. Within each sampled household, the adult with the next birthday is invited to participate, a methodology designed to ensure a random selection of adults within the household. While the ABS recruitment protocol has undergone refinements over the years, the core principle of a systematic and probability-based approach remains.
Prior to 2018, the ATP relied on random-digit-dial (RDD) surveys conducted via landline and cellphone, also administered in both English and Spanish. This shift to ABS reflects an ongoing effort within the survey research community to adapt to changing communication landscapes and improve the representativeness of national samples.
The ATP has actively worked to build and maintain a national sample of U.S. adults since 2014. Recognizing the importance of diverse perspectives, the center has periodically implemented targeted recruitment efforts, known as oversamples, to bolster the representation of specific demographic groups. For instance, Hispanic adults were oversampled in 2019, Black adults in 2022, and Asian adults in 2023. These strategic interventions are crucial for generating statistically sound estimates for smaller but significant population segments.
Sample Design: Precision Through Stratification and Oversampling
The target population for Wave 196 encompassed all noninstitutionalized persons aged 18 and older residing in the United States. The sample design for this wave was a stratified random sample drawn from the existing ATP panel. A key feature of this design was the selection with certainty of non-Hispanic Asian adults, 18- to 29-year-old validated voters, and Hispanic validated voters. This deliberate approach ensures that these specific subgroups are adequately represented in the final sample, preventing their views from being diluted by the larger population.
For the remaining panelists, the sampling rates were meticulously calibrated to ensure that the proportion of respondents within each stratum closely mirrored their proportion in the overall U.S. adult population. This meticulous stratification, combined with subsequent weighting adjustments, is fundamental to achieving a sample that accurately reflects the diversity of the American electorate and general population. The respondent weights are adjusted to compensate for any differential probabilities of selection that may arise during the sampling process, a critical step detailed further in the weighting section.
Questionnaire Development and Testing: A Foundation of Clarity and Accuracy
The integrity of survey data is heavily influenced by the quality of the questions asked. The questionnaire for Wave 196 was a product of careful deliberation, developed by Pew Research Center in close consultation with SSRS. This collaborative process ensures that the questions are not only relevant to the research objectives but are also phrased in a clear, unambiguous, and neutral manner.
Before deployment, the online survey instrument underwent rigorous testing. The SSRS project team and Pew Research Center researchers meticulously examined the web program on both personal computers and mobile devices. This testing phase was crucial for identifying and rectifying any technical glitches, ensuring logical flow, and verifying that any randomizations within the survey were functioning as intended. The team also populated test data and analyzed it using SPSS to confirm the integrity of the survey’s programming, a vital step in preventing errors that could compromise data quality.
Incentives: Encouraging Participation and Valuing Respondent Time
Recognizing that participation in surveys requires a valuable investment of time and effort, Pew Research Center employs a thoughtful incentive strategy. All respondents in Wave 196 were offered a post-paid incentive as a token of appreciation for their contribution. Participants had the flexibility to choose their incentive, opting for either a physical check or a digital gift code redeemable at major online retailers such as Amazon.com, Target.com, or Walmart.com.
The incentive amounts varied, ranging from $5 to $15, with differential amounts strategically applied based on how difficult or easy it is to reach certain segments of the population. This differential incentive approach is a well-established practice in survey research, designed to boost participation rates among groups that have historically shown lower propensities to engage with surveys. By acknowledging the varying barriers to participation, Pew Research Center aims to ensure a more equitable and representative sample.
Data Collection Protocol: A Multi-Channel Approach to Reach and Engagement
The data collection field period for Wave 196 was concentrated within a week, from July 6 to July 12, 2026. The survey was administered through two primary channels: self-administered web surveys and live telephone interviews. This dual-channel approach maximizes the potential for reaching a diverse range of respondents.
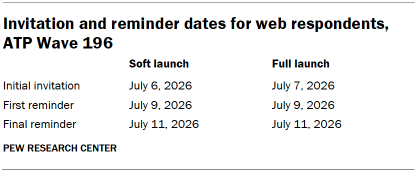
For panelists opting for the online survey, a phased invitation strategy was employed. Postcard notifications were mailed to a subset of these panelists on July 6, serving as an initial heads-up. The survey invitations themselves were launched in two stages: a soft launch and a full launch. The soft launch, commencing on July 6, involved an initial invitation to sixty carefully selected panelists. This allows for a final check of the survey’s functionality in a live environment. Following the soft launch, all remaining English- and Spanish-speaking sampled online panelists received their invitations on July 7, marking the full launch of the online component.
Panelists who chose the online route were sent an email invitation. For those who did not immediately respond, up to two email reminders were sent to encourage completion. Similarly, ATP panelists who had consented to receive SMS messages were sent an SMS invitation containing a direct link to the survey, followed by up to two SMS reminders for non-responders. This multi-touch communication strategy is designed to maximize engagement and completion rates without being overly intrusive.
For panelists who preferred or were more accessible via telephone, a parallel protocol was in place. Prenotification postcards were mailed on July 2 to inform them of the upcoming survey. The telephone data collection also began with a soft launch on July 6, involving interviewers dialing numbers until a total of three completed interviews were secured. Subsequently, throughout the remaining field period, interviewers systematically dialed the numbers of all remaining English- and Spanish-speaking sampled phone panelists. Panelists participating via phone could receive up to six calls from trained SSRS interviewers, a robust effort to connect with potential respondents.
Data Quality Checks: Upholding the Integrity of Findings
Maintaining the highest standards of data quality is a non-negotiable aspect of rigorous survey research. Pew Research Center researchers meticulously performed data quality checks to identify any respondents exhibiting patterns of "satisficing." Satisficing refers to respondents who provide satisfactory but not optimal answers, often due to cognitive fatigue or a lack of engagement. Indicators of satisficing can include excessively high rates of leaving questions blank or consistently selecting the first or last answer choice presented, regardless of content.
As a direct result of these thorough quality checks, two respondents from the ATP panel were identified and subsequently removed from the survey dataset before any weighting or analysis took place. This proactive measure ensures that the final dataset is free from the potential biases introduced by respondents who did not engage with the survey in a manner that yields meaningful data.
Weighting: The Crucial Step in Achieving Representativeness
The complex process of weighting is indispensable for transforming raw survey data into a nationally representative dataset. The ATP data undergoes a multi-stage weighting procedure that accounts for various factors, including the initial probability of a panelist being recruited into the panel. Each panelist begins with a base weight that reflects their likelihood of selection during the recruitment phase.
These base weights are then systematically calibrated to align with established population benchmarks. This calibration corrects for nonresponse that occurred during the initial recruitment surveys and addresses panel attrition—the gradual loss of panelists over time. If, as in Wave 196, only a subsample of panelists was invited to participate in a particular wave, the weights are further adjusted to account for any differential probabilities of selection within that subsample.
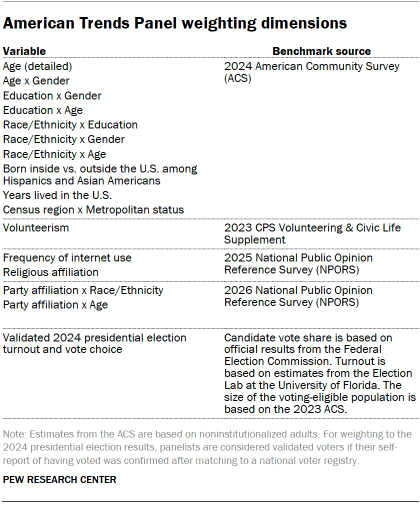
Among the panelists who successfully completed the survey, the weights are again calibrated to align with the population benchmarks detailed in accompanying tables. This recalibration ensures that the final sample accurately reflects the demographic composition of the U.S. adult population on key characteristics. To mitigate the potential for extreme weights to disproportionately influence the results and to enhance precision, these weights are trimmed at the 1st and 99th percentiles. This trimming process reduces the variance in the weights, leading to more stable and reliable estimates. Crucially, sampling errors and tests of statistical significance are calculated with full consideration of the effects of this weighting procedure.
Understanding Sampling Error and Limitations
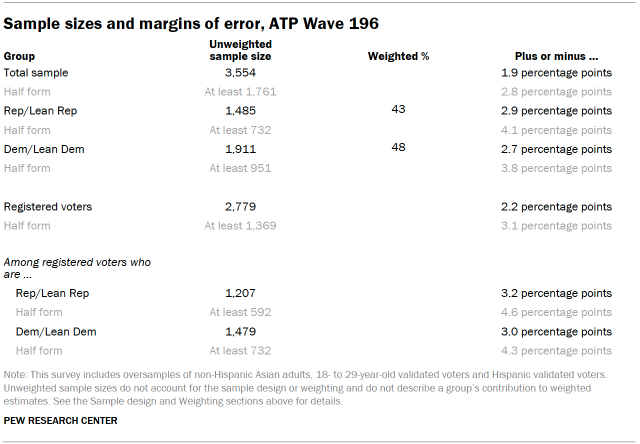
The reliability of survey findings is often quantified by the margin of sampling error. For Wave 196, the margin of sampling error for the full sample of 3,554 respondents is ±1.9 percentage points at the 95% confidence level. This means that if the survey were repeated 100 times with different samples drawn using the same methodology, the results would fall within this margin of error 95% of the time.
The accompanying tables provide unweighted sample sizes and the expected sampling errors for various groups within the survey. It is important for users of the data to consult these tables for specific subgroup margins of error, which can vary depending on the size of the subgroup. Sample sizes and sampling errors for other subgroups not explicitly listed are available upon request from Pew Research Center.
Beyond sampling error, it is essential to acknowledge that other factors can introduce error or bias into the findings of opinion polls. These include the specific wording of survey questions, the practical challenges inherent in conducting large-scale surveys, and potential respondent misinterpretations. Pew Research Center’s commitment to rigorous methodology aims to minimize these potential sources of error, but complete elimination is not feasible in any survey research.
Dispositions and Response Rates: A Detailed Look at Panel Engagement
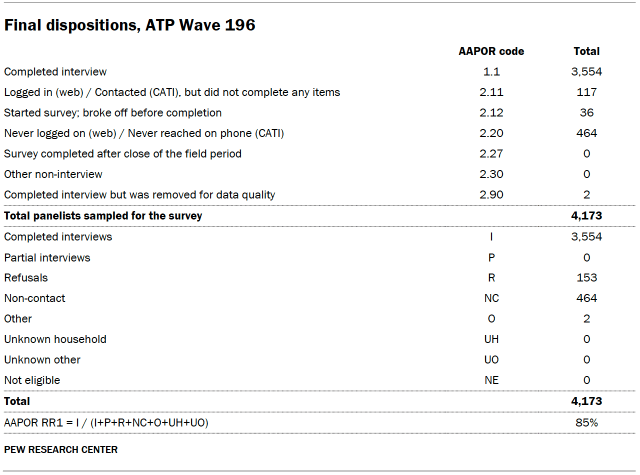
The detailed tables on final dispositions and cumulative response rates offer a transparent view of the panel’s engagement throughout Wave 196. These figures illustrate the comprehensive efforts made to reach and survey panelists, as well as the outcomes of those efforts. The disposition tables typically categorize the status of each sampled unit—whether they completed the survey, refused to participate, were unreachable, or fell into other categories. The cumulative response rate provides an overarching measure of the panel’s health and the success of ongoing recruitment and retention efforts. These metrics are vital for researchers and the public alike to understand the depth and breadth of the data collected.
In conclusion, Wave 196 of the American Trends Panel exemplifies Pew Research Center’s dedication to methodological excellence. Through a carefully designed sampling strategy, robust recruitment processes, meticulous questionnaire development, strategic incentives, and rigorous data quality checks, the ATP continues to provide high-quality, representative data that serves as an invaluable resource for understanding the complex landscape of American public opinion. The transparency regarding their methodology allows for informed interpretation of their findings and reinforces trust in the research produced.