
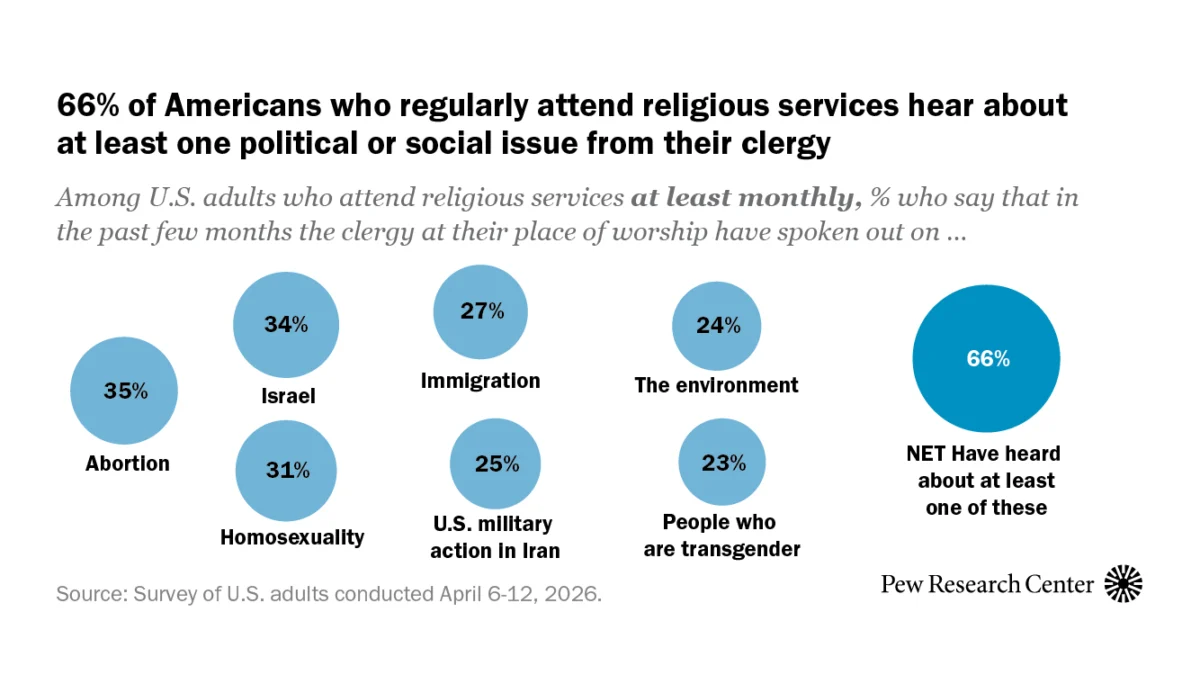
Pew Research Center’s rigorous methodology underpins its latest findings from Wave 191 of the American Trends Panel (ATP), a nationally representative survey of U.S. adults conducted from April 6-12, 2026. This detailed examination of the survey’s design and execution provides critical context for understanding the data, particularly concerning religious service attendance, which formed the basis for analysis of 1,391 respondents who indicated they attend religious services at least once or twice a month. The survey achieved a robust survey-level response rate of 95%, with 3,592 panelists responding out of 3,775 who were sampled. However, the cumulative response rate, accounting for recruitment and attrition, stands at 3%, and the break-off rate among those starting the survey was less than 1%. The margin of sampling error for the analyzed subgroup of frequent religious service attendees is plus or minus 3.5 percentage points, a standard measure of statistical precision.
To ensure comprehensive representation and more precise estimates for smaller demographic subgroups, the survey employed oversampling techniques. This included specific efforts to gather sufficient data from non-Hispanic Asian adults, White evangelical Protestants who attend church monthly, White nonevangelical Protestants who attend church monthly, Black Protestants who attend church monthly, and Catholics who attend church monthly. These oversampled groups were subsequently weighted back to accurately reflect their proportion within the broader U.S. adult population. The data collection was a hybrid effort, with SSRS conducting the survey via online interviews for the vast majority of participants (n=3,491) and live telephone interviews for a smaller segment (n=101). Interviews were conducted in both English and Spanish to accommodate linguistic diversity.

Panel Recruitment: A Foundation of Robust Representation
The American Trends Panel has refined its recruitment strategy over the years to enhance its representativeness. Since 2018, the ATP has predominantly utilized Address-Based Sampling (ABS) for its recruitment efforts. This method involves mailing cover letters and pre-incentives to a stratified, random sample of households drawn from the U.S. Postal Service’s Computerized Delivery Sequence File, a file estimated to cover between 90% and 98% of the U.S. population. Within each selected household, the adult with the next birthday is identified as the potential respondent, a systematic approach designed to avoid selection bias within households. While specific ABS recruitment protocols have evolved, detailed information is available upon request. Prior to 2018, the ATP relied on landline and cellphone random-digit-dial surveys for recruitment, administered in both English and Spanish.
The ATP has been actively recruiting a national sample of U.S. adults approximately annually since 2014. To bolster the accuracy of data for underrepresented groups, specific recruitment drives, known as "oversamples," have been implemented in various years. For instance, Hispanic adults were oversampled in 2019, Black adults in 2022, and Asian adults in 2023, reflecting a continuous effort to improve the panel’s demographic balance.
Sample Design: Stratification for Precision
The target population for this specific survey encompassed all noninstitutionalized individuals aged 18 and older residing in the United States. The sample design for Wave 191 of the ATP was a stratified random sample, with specific emphasis on oversampling the aforementioned religious subgroups to ensure adequate sample sizes for detailed analysis. The remaining panelists were selected at rates designed to maintain proportionality with their representation in the U.S. adult population. Crucially, respondent weights are adjusted to correct for any differential probabilities of selection, a standard practice in survey research to ensure the sample accurately reflects the population.
Questionnaire Development and Data Collection: Ensuring Accuracy and Accessibility
The survey instrument, or questionnaire, was meticulously developed by Pew Research Center in close consultation with SSRS, the survey research firm responsible for data collection. The online survey platform underwent rigorous testing by both the SSRS project team and Pew Research Center researchers to ensure its functionality and accuracy across various devices, including PCs and mobile phones. The SSRS team also populated test data, which was analyzed using statistical software (SPSS) to verify the logic and randomizations embedded within the survey before its official launch.
To encourage participation, all respondents were offered a post-paid incentive. This incentive could be received as a check or as a gift code redeemable at major online retailers like Amazon.com, Target.com, or Walmart.com. The incentive amounts, ranging from $5 to $15, were strategically varied based on how difficult or easy a particular demographic group is to reach. This differential incentive structure is a deliberate strategy to boost survey participation rates among groups that historically exhibit lower response propensities.
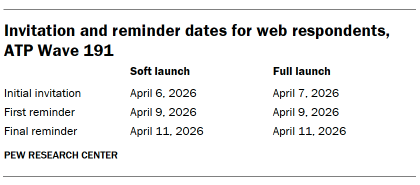
The data collection period for this wave spanned from April 6 to April 12, 2026. Data was collected through two primary methods: self-administered web surveys and live telephone interviews. For online participants, notification postcards were mailed on April 6. The survey invitations were then deployed in two phases: a soft launch involving 60 panelists, which commenced on April 6, and a full launch on April 7, encompassing all remaining English- and Spanish-speaking sampled online panelists. Panelists participating online received an email invitation and up to two email reminders if they did not complete the survey. Those who had consented to SMS notifications received an SMS invitation with a direct link to the survey, accompanied by up to two SMS reminders.
For panelists opting for telephone interviews, prenotification postcards were mailed on April 3. A soft launch for telephone data collection occurred on April 6, with interviewers making calls until a total of five interviews were completed. Subsequently, the phone numbers of all remaining English- and Spanish-speaking sampled panelists were dialed throughout the remainder of the field period. Interviewers from SSRS made up to six calls to reach panelists for telephone surveys, a standard practice to maximize contact rates.
Data Quality Assurance: Safeguarding Integrity
Pew Research Center researchers implemented comprehensive data quality checks to identify and mitigate potential issues such as satisficing, where respondents may provide superficial or unengaged answers. This involved scrutinizing response patterns for indicators like unusually high rates of unanswered questions or consistent selection of the first or last option presented in a question. As a result of these rigorous checks, three ATP respondents were excluded from the final survey dataset prior to weighting and analysis, ensuring the integrity of the reported findings.
Weighting: Reconciling Sample with Population
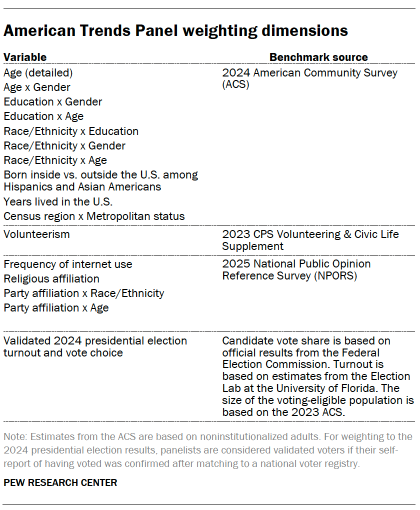
The weighting process for the ATP data is a multi-stage procedure designed to account for the complexities of sampling and nonresponse across the panel survey lifecycle. Each panelist is assigned an initial base weight reflecting their probability of being recruited into the panel. These weights are then calibrated against established population benchmarks, as detailed in accompanying tables, to correct for nonresponse to recruitment surveys and attrition from the panel over time. If a specific wave of the survey involves inviting only a subsample of panelists, the base weight is further adjusted to reflect any differential probabilities of selection within that subsample.
Among the panelists who successfully completed the survey, the weights are recalibrated once more against population benchmarks. This recalibration ensures that the weighted sample accurately mirrors the demographic and attitudinal characteristics of the U.S. adult population. To minimize the impact of extreme weights on statistical precision, the weights are trimmed at the 1st and 99th percentiles. The calculation of sampling errors and tests of statistical significance explicitly accounts for the effect of this weighting process.
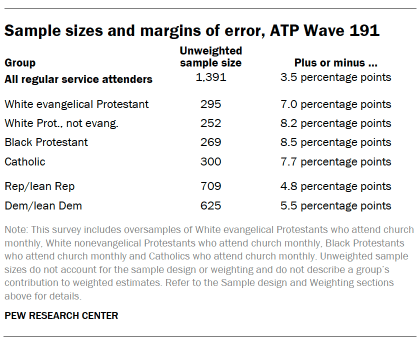
The accompanying tables provide unweighted sample sizes and the expected sampling error at a 95% confidence level for various groups within the survey. For the specific subgroup of respondents attending religious services at least once or twice a month, the margin of sampling error is ±3.5 percentage points. This level of precision is crucial for drawing reliable conclusions about the opinions and behaviors of this particular segment of the population. Sample sizes and sampling errors for other demographic subgroups are available upon request, offering a comprehensive view of the survey’s statistical capabilities. It is important to note that in addition to sampling error, potential biases can arise from question wording and practical challenges inherent in conducting any opinion poll.
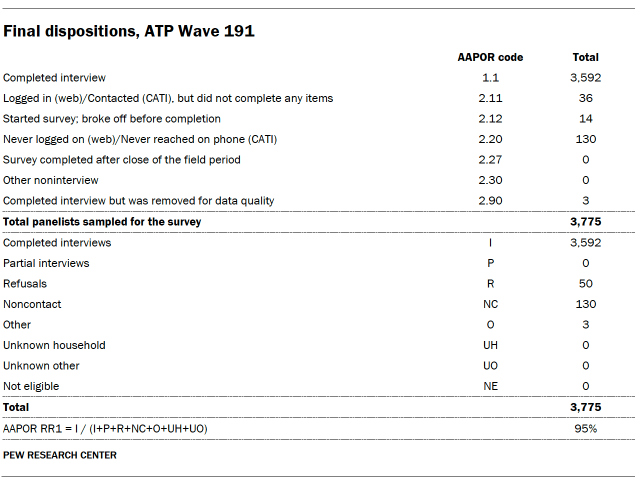
Dispositions and Response Rates: A Measure of Engagement
The final disposition of sampled individuals and the overall response rates provide a clear picture of the survey’s reach and the engagement of the panelists. The detailed disposition tables illustrate the breakdown of contacted individuals, including those who completed the survey, refused, were ineligible, or could not be reached. These figures are essential for understanding the universe of potential respondents and the proportion that ultimately contributed to the study’s findings. The cumulative response rate, a critical metric for evaluating the overall efficiency and representativeness of the survey process, stood at 3% when accounting for all stages of recruitment and attrition. While this figure may appear low, it is typical for longitudinal panel studies where the cumulative nature of nonresponse over time can significantly impact the overall rate. The survey-level response rate of 95% for Wave 191 itself indicates a high level of engagement from the active panel members during the specific survey period.
Implications and Context
The meticulous methodology employed in Wave 191 of the American Trends Panel is designed to produce reliable and valid data on a wide array of social and political issues. By combining robust panel recruitment, careful sample design, rigorous questionnaire development, and sophisticated weighting techniques, Pew Research Center aims to provide its audience with insights that accurately reflect the diverse perspectives of the American populace. The focus on religious service attendance in this particular wave, supported by oversampling of key religious subgroups, suggests an intent to explore the nuanced relationship between faith, social engagement, and potentially other societal trends. The detailed reporting on methodology is not merely a procedural exercise but a fundamental component of scientific inquiry, allowing researchers, policymakers, and the public to critically assess the findings and understand their limitations. The continued commitment to transparency in survey methodology is paramount in an era where public trust in data and research is increasingly vital.


