
Inflation in the United States reached its highest level in three years in April, according to the Bureau of Labor Statistics (BLS). This economic reality is palpable for many Americans, with a Pew Research Center survey conducted in April revealing that 66% of U.S. adults consider inflation a very significant problem facing the nation, an increase from 63% the previous year. This widespread concern naturally leads to a crucial question: have workers’ wages been rising sufficiently to counteract the erosion of purchasing power? The answer, as is often the case in economics, is nuanced and depends heavily on a variety of factors, including how wages are defined, which worker populations are examined, how inflation is measured, and the specific time periods under analysis.
This analysis aims to illuminate how even a single variable – the method of measuring inflation – can dramatically alter the perceived economic landscape for American workers. For instance, without adjusting for inflation, median weekly wages saw more than a doubling between the end of 1999 and the end of 2025, climbing from $482 to $1,040. However, when inflation is factored in, the real buying power over this same span increased by a more modest 11% to 22%, contingent upon the specific price index employed.
Understanding the Metrics: Wages and Inflation
To provide a comprehensive view, this analysis draws upon data from the Current Population Survey (CPS) on weekly earnings for employed civilian wage and salary workers, sourced from the Integrated Public Use Microdata Series (IPUMS) project at the University of Minnesota. Weekly earnings were chosen for ease of comprehension, as average hours worked have remained relatively stable in recent years, with notable exceptions during the Great Recession and the COVID-19 pandemic. Median earnings were utilized over average earnings to mitigate the distorting effect of extremely high salaries, ensuring a more representative picture of the typical worker. It is important to note that these figures exclude earnings from self-employment.
The analysis period spans from December 1999, the earliest month for which data from all four inflation indexes was available, to December 2025, the most recent month for which data from the retroactive series is accessible.
Deconstructing Inflation Measures
The most commonly cited measure of inflation is the Consumer Price Index for All Urban Consumers (CPI-U), calculated by the BLS. This index, with roots tracing back to World War I, is based on monthly surveys of retail prices for a broad basket of goods and services. The CPI-U’s strengths lie in its historical depth, facilitating long-term comparisons, and its monthly timeliness, offering current insights into price changes. It closely tracks household spending patterns, making it a valuable tool for understanding the price evolution of everyday items like milk, as demonstrated by its consistent tracking since the 1950s.
However, some economists contend that the CPI-U may overstate the true rate of inflation. A primary criticism is its delayed reflection of changes in consumer behavior. For example, if the price of a staple good like steak rises significantly, consumers might shift to purchasing more affordable alternatives such as chicken. If the CPI-U’s market basket is slow to adapt and still contains a substantial weighting of the now more expensive steak, it could artificially inflate the reported inflation rate. While the BLS now updates the composition of its market basket annually, a departure from the previous 10- to 15-year update cycles, such criticisms persist, alongside other methodological debates, such as the estimation of shelter costs.
Alternative Inflation Gauges
To address the limitations of the CPI-U, several alternative inflation measures are employed. The Chained Consumer Price Index (C-CPI-U), introduced by the BLS in 2002, aims to capture shifts in consumer spending more rapidly. By accounting for substitution effects – where consumers switch to cheaper goods when prices rise – the C-CPI-U generally produces lower inflation readings than the CPI-U.
The CPI retroactive series (R-CPI-U-RS) offers a consistent historical perspective, reflecting inflation as if measured by current methodologies throughout its history, which dates back to December 1977. This provides a more stable basis for long-term wage comparisons, smoothing out the effects of methodological changes over time.
A third crucial measure is the Personal Consumption Expenditures (PCE) price index, produced by the Bureau of Economic Analysis (BEA). This index is the Federal Reserve’s preferred inflation gauge and is integral to calculating U.S. Gross Domestic Product. Unlike the CPI, which relies on consumer surveys, the PCE is based on data from businesses about what they sell. This fundamental difference in data sourcing, along with variations in the goods and services included and their weighting, typically results in the PCE yielding a lower inflation estimate compared to the CPI family. Historically, the gap between PCE and CPI inflation was more pronounced, though recent trends have shown them converging, and in some periods, PCE inflation has even surpassed CPI inflation.

The Impact of Inflation Measurement on Real Wage Growth
The divergence in inflation measures directly impacts the calculation of real wage growth. For instance, between December 1999 and December 2025:
- Using the Main CPI (CPI-U): Median weekly earnings adjusted for inflation would show a 93% increase.
- Using the CPI Retroactive Series: Real wage growth is estimated at 94%.
- Using the Chained CPI (C-CPI-U): This measure indicates a more conservative real wage growth of 80%.
- Using the PCE Price Index: The PCE suggests the most substantial real wage growth, at 77%.
These variations highlight the critical importance of specifying the inflation measure when discussing wage trends.
Wage Growth Across Different Timeframes
The chosen timeframe significantly influences the perceived trajectory of real wage growth. Examining different periods reveals distinct patterns:
-
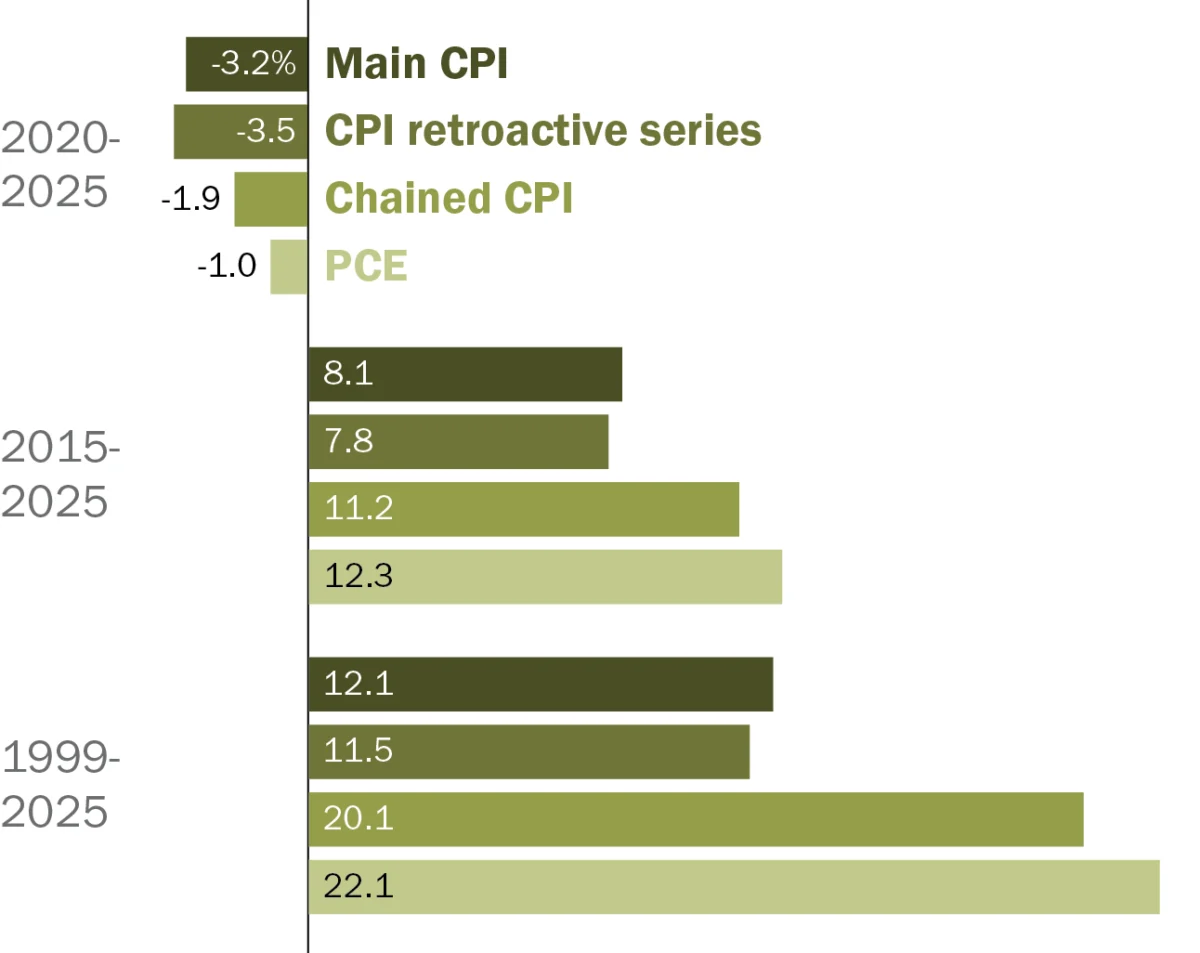
December 1999 to December 2025: Over this extended period, median weekly wages consistently outpaced inflation across all four examined indexes, demonstrating positive real wage growth. The most robust growth was observed when using the PCE index (22.1%), while the most conservative estimate came from the Chained CPI (11.5%).
-
December 2015 to December 2025: In this more recent period, real wage growth remained positive regardless of the inflation index used. The PCE index again showed the strongest growth at 12.3%, followed by the Chained CPI at 11.2%.
-
December 2020 to December 2025: This period, encompassing significant economic disruptions, tells a different story. After adjusting for inflation, median weekly wages experienced a decline across all measured indexes. The most significant real wage decrease was seen with the CPI retroactive series (-3.5%), while the Chained CPI showed a -1.9% real wage decline.
These fluctuations underscore the dynamic nature of the economy and the impact of economic events like the COVID-19 pandemic and subsequent supply chain disruptions on both wages and prices.
Broader Implications and Considerations
Beyond the choice of inflation index and timeframe, other factors significantly shape the narrative of wage growth. The definition of "wages" itself can vary, including or excluding components like bonuses, overtime pay, and benefits. Similarly, the population under consideration – whether it includes all workers, only wage and salary earners, or specific demographic groups – can alter the results. The inclusion of managerial and executive salaries versus focusing solely on nonsupervisory workers also presents a different picture of wage dynamics.
The historical context of U.S. inflation is also vital. The nation experienced periods of high inflation, exceeding 10% annually, in the 1970s and early 1980s. Conversely, the Great Recession saw periods of disinflation and even deflation. Capturing these periods within an analysis significantly impacts the calculated real wage growth.
The current economic environment, marked by elevated inflation in recent years, poses a significant challenge for households striving to maintain their purchasing power. While nominal wages may be rising, if the rate of inflation consistently outpaces wage increases, the real value of those wages diminishes, leading to a decline in living standards for many. This situation can lead to increased financial stress, reduced consumer spending, and potential social unrest. Policymakers, including the Federal Reserve, closely monitor these trends, employing monetary policy tools to manage inflation and support sustainable economic growth. The ongoing debate surrounding the appropriate measurement of inflation and its impact on wages remains a critical aspect of economic discourse, directly affecting the financial well-being of millions of Americans.


