

Pew Research Center’s American Trends Panel (ATP) has released the methodology behind its latest survey, Wave 192, providing a comprehensive look at the rigorous process employed to gather nationally representative data. The survey, conducted between April 20 and April 26, 2026, engaged 5,103 panelists out of an initial sample of 5,898, achieving a robust survey-level response rate of 87%. This high response rate is a testament to the panel’s established methodologies and ongoing commitment to maintaining a representative sample of U.S. adults.
Understanding the Rigorous Survey Design and Execution
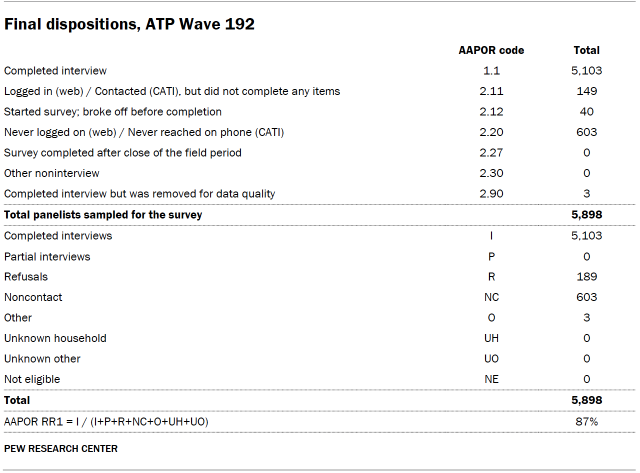
The data underpinning this report originates from Wave 192 of the American Trends Panel (ATP), a cornerstone of Pew Research Center’s data collection efforts. This nationally representative panel comprises randomly selected U.S. adults, meticulously recruited and maintained to reflect the diverse demographics of the nation. The survey window for this particular wave was a concentrated period from April 20 to April 26, 2026. Out of the 5,898 individuals sampled, a significant 5,103 panelists actively participated, resulting in a survey-level response rate of 87%. This figure signifies the proportion of the sampled individuals who completed the survey.
Beyond the immediate survey response, the ATP’s methodology accounts for a more extensive picture of panel engagement. The cumulative response rate, which factors in nonresponse during the initial recruitment phase and subsequent attrition over time, stands at 3%. This long-term perspective highlights the sustained effort required to maintain a stable and representative panel. Furthermore, the break-off rate, indicating panelists who begin the survey but do not complete it, is remarkably low at 1%, suggesting a high level of engagement and satisfaction with the survey instrument once initiated.

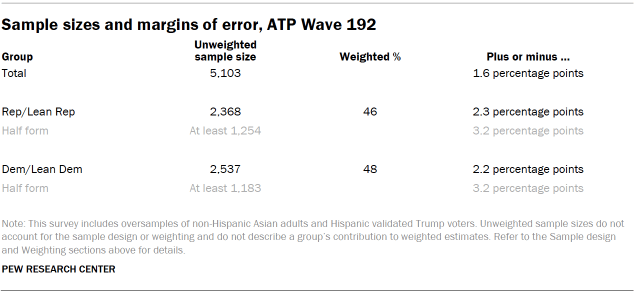
For the full sample of 5,103 respondents, the margin of sampling error is calculated at plus or minus 1.6 percentage points at the 95% confidence level. This statistical measure provides a crucial understanding of the potential variability inherent in survey data, assuring readers that findings are within a predictable range of the true population values.
A key feature of the ATP’s design is its strategic use of oversampling to ensure sufficient data for smaller demographic groups. In this wave, non-Hispanic Asian adults and Hispanic validated Trump voters were specifically oversampled. This targeted approach allows for more precise estimates of the opinions and experiences of these particular subgroups, which might otherwise be lost in a general population sample. It is critical to note that these oversampled groups are subsequently weighted back to their correct proportions within the overall U.S. adult population, ensuring that the final results accurately reflect national demographics.
The survey itself was conducted by SSRS, a reputable survey research firm, on behalf of Pew Research Center. The data collection employed a dual approach, utilizing both online interviewing for the vast majority of respondents (n=4,900) and live telephone interviewing for a smaller, complementary segment (n=203). This mixed-mode approach is designed to maximize reach and accommodate diverse respondent preferences and access to technology. Interviews were made available in both English and Spanish to ensure inclusivity. Further detailed information about the ATP’s broader operational framework can be found in the dedicated "About the American Trends Panel" resource.
A Deep Dive into Panel Recruitment and Sample Design
The foundation of the ATP’s representativeness lies in its sophisticated panel recruitment strategy, which has evolved over time. Since 2018, the panel has primarily relied on address-based sampling (ABS) for recruitment. This method begins with mailing a study cover letter and a pre-incentive to a stratified, random sample of households identified from the U.S. Postal Service’s Computerized Delivery Sequence File. This file is known to cover a substantial portion of the U.S. population, estimated between 90% and 98%. Within each selected household, the adult whose birthday falls next is invited to participate. While the specifics of the ABS recruitment protocol may have undergone refinements since its inception, detailed information is available upon request. Prior to 2018, the ATP recruitment was conducted through landline and cellphone random-digit-dial surveys, also administered in both English and Spanish.
The ATP has consistently sought to build a national sample of U.S. adults annually since 2014. In certain years, this recruitment process has incorporated targeted oversampling efforts to bolster the accuracy of data for underrepresented populations. For instance, Hispanic adults were oversampled in 2019, Black adults in 2022, and Asian adults in 2023, demonstrating a proactive approach to capturing the nuances of diverse demographic groups.
The sample design for Wave 192 specifically targeted noninstitutionalized persons aged 18 and older residing in the United States. The survey employed a stratified random sample drawn from the existing ATP panel. As mentioned, non-Hispanic Asian adults and Hispanic validated Trump voters were identified as groups requiring oversampling to ensure adequate representation and precise estimation. The remaining panelists were selected at rates calculated to maintain proportionality with their respective shares of the U.S. adult population, to the greatest extent feasible. Crucially, respondent weights are adjusted to compensate for any differential probabilities of selection, a process detailed further in the Weighting section.
Ensuring Data Integrity: Questionnaire Development and Data Collection
The accuracy and reliability of survey data are critically dependent on the quality of the questionnaire and the meticulousness of the data collection process. The questionnaire for Wave 192 was a collaborative effort, developed by Pew Research Center in close consultation with SSRS. This partnership ensures that the questions are not only relevant to the research objectives but also adhere to best practices in survey design.
Before deployment, the web-based survey instrument underwent rigorous testing. The SSRS project team and Pew Research Center researchers systematically evaluated the program on both personal computer (PC) and mobile device platforms. This thorough testing phase is essential to identify and rectify any technical glitches, ensure a seamless user experience for respondents, and verify the integrity of the survey logic and randomizations. The SSRS team further populated test data that was meticulously analyzed using SPSS to confirm that all question logic and randomization schemes functioned precisely as intended prior to the official launch.
Incentives and Data Collection Protocol
To encourage participation and acknowledge the valuable time of panelists, all respondents were offered a post-paid incentive. Participants had the flexibility to choose their incentive delivery method, opting for a check or a digital gift code redeemable at major online retailers such as Amazon.com, Target.com, or Walmart.com. The incentive amounts varied, ranging from $5 to $15. This differential incentive structure was intentionally designed to address varying levels of difficulty in reaching certain population segments. By offering higher incentives to groups traditionally harder to survey, the ATP aims to boost participation rates among these demographics, thereby enhancing the overall representativeness of the panel.
The data collection for this wave officially commenced on April 20, 2026, and concluded on April 26, 2026. The survey was administered through two primary modes: self-administered online surveys and live telephone interviews.
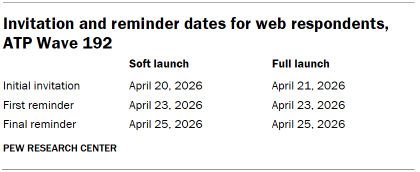
For panelists opting for the online survey, a multi-stage notification process was employed. On April 20, postcards were mailed to a subset of panelists, serving as an initial heads-up. Survey invitations were then disseminated in two distinct phases: a soft launch and a full launch. The soft launch, which began with an initial invitation sent on April 20, included approximately sixty panelists. This controlled rollout allows for final checks on the survey platform and response mechanisms. Subsequently, all remaining English- and Spanish-speaking sampled online panelists received their invitations on April 21 as part of the full launch.
Panelists participating online received an email invitation. For those who did not immediately respond, up to two email reminders were sent to encourage completion. Furthermore, ATP panelists who had previously consented to receive SMS messages were sent an SMS invitation containing a direct link to the survey, followed by up to two SMS reminders for non-responders.
For panelists who preferred or required assistance through live telephone interviews, a similar prenotification process was implemented. Prenotification postcards were mailed on April 17. The soft launch for telephone surveys began on April 20, with interviewers dialing until a total of five completed interviews were secured. Throughout the remainder of the field period, numbers for all remaining English- and Spanish-speaking sampled phone panelists were dialed. To ensure thorough engagement and maximize response, panelists participating via phone could receive up to six calls from trained SSRS interviewers.
Robust Data Quality Checks and Weighting Methodology
Maintaining the integrity of the collected data is paramount. Pew Research Center researchers implemented stringent data quality checks to identify any respondents exhibiting patterns indicative of satisficing, a behavior where respondents put minimal effort into answering questions. This included scrutinizing response patterns for unusually high rates of unanswered questions or consistent selection of the first or last answer option presented. As a result of these checks, three ATP respondents were excluded from the survey dataset prior to the weighting and analysis stages, ensuring that the final results are based on the most engaged and thoughtful participants.
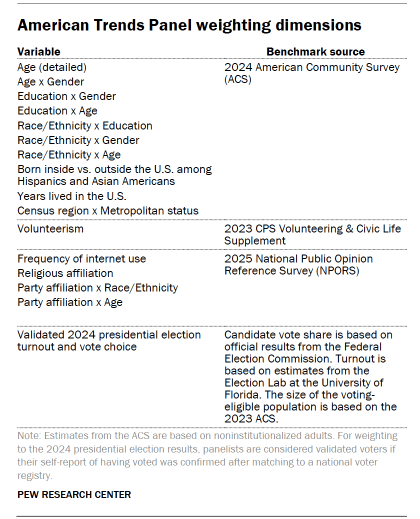
The weighting process for ATP data is a complex, multi-stage procedure designed to correct for various forms of nonresponse and sampling probabilities that occur throughout the panel survey lifecycle. Initially, each panelist is assigned a base weight reflecting their likelihood of being recruited into the panel. These base weights are then calibrated to align with specific population benchmarks, as detailed in accompanying tables. This calibration addresses nonresponse during the initial recruitment surveys and any subsequent attrition from the panel. If only a subset of panelists is invited for a particular wave, the weights are further adjusted to account for any differential probabilities of selection within that subsample.
For panelists who successfully completed the survey, their weights undergo another round of calibration to match population benchmarks. To mitigate the potential loss of precision that can arise from extreme weight values, these weights are trimmed at the 1st and 99th percentiles. Sampling errors and tests of statistical significance are calculated while taking into account the impact of this weighting procedure.
The accompanying tables provide crucial information regarding the unweighted sample sizes and the expected sampling error at the 95% confidence level for various demographic groups within the survey. These figures are essential for researchers and the public to understand the statistical precision of the findings. Sample sizes and sampling errors for other specific subgroups can be made available upon request. Beyond sampling error, it is important to acknowledge that other factors, such as the precise wording of survey questions and practical challenges encountered during survey administration, can introduce additional error or bias into the reported findings of opinion polls.
Dispositions and Response Rates: A Detailed Breakdown
The comprehensive reporting of dispositions and response rates offers transparency into the survey’s operational success. These metrics are vital for understanding the reach and representativeness of the data. The provided tables detail the final status of all sampled individuals, categorizing them into completed surveys, refusals, ineligibles, and other dispositions. This granular breakdown allows for a thorough assessment of the data collection effort.
The cumulative response rate, meticulously calculated, provides a long-term perspective on the panel’s ability to engage its members over time. This figure is crucial for understanding the panel’s overall health and its capacity to consistently deliver reliable data. The figures presented underscore Pew Research Center’s commitment to methodological rigor and transparency in its public opinion research.


