Pew Research Center’s rigorous methodology for its American Trends Panel (ATP) survey, as detailed in Wave 185 conducted from January 20-26, 2026, underscores a commitment to national representativeness and nuanced demographic analysis. This comprehensive approach, involving extensive recruitment, stratified sampling, detailed questionnaire development, strategic incentives, and multi-stage weighting, aims to produce data that accurately reflects the opinions and experiences of a diverse U.S. adult population. The methodology provides a robust framework for understanding public sentiment on critical issues, ensuring that findings are both statistically sound and broadly applicable.
Overview of the American Trends Panel (ATP) Wave 185
The latest data from the American Trends Panel (ATP), Wave 185, was collected between January 20 and January 26, 2026. This wave saw a participation rate of 92%, with 8,512 panelists responding out of a sampled 9,302. This high survey-level response rate is a testament to the panel’s established infrastructure and the trust built with its members. The cumulative response rate, which accounts for all stages of potential nonresponse and attrition since initial recruitment, stands at 3%. This figure, while seemingly low, is typical for longitudinal panels that track individuals over extended periods and reflect the challenges of maintaining a consistent respondent base. The break-off rate, meaning panelists who began the survey but did not complete it, was a minimal 2%.
A critical aspect of the ATP’s design is its commitment to providing precise estimates for smaller demographic subgroups. To achieve this, the survey incorporates oversamples of non-Hispanic Asian adults and adults aged 18 to 29. These groups, often underrepresented in broader national surveys, are specifically targeted to ensure their views are captured with sufficient statistical power. Importantly, these oversampled groups are weighted back to their accurate proportions within the general U.S. adult population during the data analysis phase, preventing any distortion of overall national figures.

The survey was administered by SSRS on behalf of Pew Research Center, utilizing a mixed-mode approach. The vast majority of respondents, 8,272, participated via online interviews, while 240 completed the survey through live telephone interviews. This bilingual approach, with interviews available in both English and Spanish, further enhances the inclusivity and accuracy of the data.
Panel Recruitment: A Foundation of Representativeness
Since 2018, the ATP has employed address-based sampling (ABS) for its recruitment efforts. This method involves mailing study cover letters and pre-incentives to a stratified, random sample of households selected from the U.S. Postal Service’s Computerized Delivery Sequence File, which is known to cover between 90% and 98% of U.S. households. A key feature of the ABS protocol is the selection of the adult within each sampled household who has the next birthday, ensuring an age-representative selection within the household. While specific details of the ABS recruitment protocol have evolved, they are available upon request. Prior to 2018, the ATP relied on landline and cellphone random-digit-dial surveys for recruitment, also conducted in English and Spanish.
The ATP has consistently recruited a national sample of U.S. adults annually since 2014. In select years, the recruitment process has included targeted oversampling efforts to bolster the representation of specific demographic groups. For instance, Hispanic adults were oversampled in 2019, Black adults in 2022, and Asian adults in 2023, demonstrating a proactive strategy to ensure robust data on these communities.
Sample Design: Precision and Proportionality
The target population for Wave 185 encompassed all noninstitutionalized persons aged 18 and older residing in the United States. The sample design for this wave was a stratified random sample drawn from the existing ATP membership who had previously completed Wave 183. Non-Hispanic Asian adults and adults aged 18 to 29 were designated as "selected with certainty," meaning they were guaranteed inclusion in the sample for this wave. This selection process ensures adequate representation from these crucial subgroups. The remaining panelists were sampled at rates calibrated to maintain proportionality with their respective shares of the U.S. adult population, as far as practically achievable. The final respondent weights are adjusted to correct for any differential probabilities of selection, as detailed in the weighting section.
Questionnaire Development and Testing: Ensuring Accuracy
The questionnaire for Wave 185 was meticulously developed by Pew Research Center in close consultation with SSRS, the survey research firm responsible for data collection. The online survey instrument underwent rigorous testing by both the SSRS project team and Pew Research Center researchers. This testing phase was conducted on a variety of devices, including PCs and mobile phones, to ensure a seamless and accurate user experience for all online respondents. Furthermore, the SSRS team populated test data that was subsequently analyzed using SPSS. This meticulous process verified the logic and randomizations embedded within the survey, guaranteeing that the data collection proceeded as intended before the live launch.
Incentives: Encouraging Participation
To foster high participation rates and acknowledge the valuable time of panelists, all respondents were offered a post-paid incentive. This incentive could be received as a check or as a digital gift code for popular online retailers such as Amazon.com, Target.com, or Walmart.com. The value of these incentives ranged from $5 to $20, with differential amounts allocated based on the demographic group’s historical propensity for survey participation. This strategy is designed to particularly encourage participation from groups that are traditionally harder to reach and may have lower survey response rates.
Data Collection Protocol: A Multi-Modal Approach
The data collection period for Wave 185 spanned from January 20 to January 26, 2026. Surveys were administered through two primary modes: self-administered web surveys and live telephone interviews.
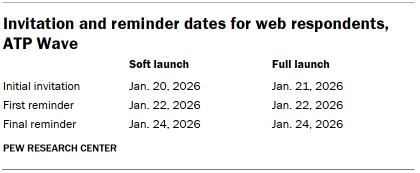
For panelists opting for the online survey, a phased approach to invitations was implemented. Postcard notifications were mailed to a subset of panelists on January 20. The survey invitations themselves were sent out in two distinct launches. A "soft launch" began on January 20, including approximately sixty panelists, to identify and resolve any immediate technical issues. Following this, a "full launch" commenced on January 21, extending invitations to all remaining English- and Spanish-speaking sampled online panelists. Panelists who consented to receive SMS messages were also provided with an invitation via text, including a direct link to the survey, and received up to two SMS reminders if they did not initially respond.
Panelists who preferred or were selected for telephone interviews were also pre-notified. Prenotification postcards were mailed on January 16. The telephone data collection also began with a soft launch on January 20, with interviewers continuing to dial until a total of four interviews were completed. Subsequently, numbers for all remaining English- and Spanish-speaking sampled phone panelists were dialed throughout the remainder of the field period. Trained SSRS interviewers made up to six calls to each sampled panelist to encourage participation.
Data Quality Checks: Upholding Integrity
Pew Research Center researchers implemented stringent data quality checks to ensure the integrity of the collected information. These checks were designed to identify any respondents exhibiting patterns of "satisficing," a phenomenon where respondents provide answers that are minimally acceptable rather than fully considered. This involved scrutinizing response patterns for unusually high rates of unanswered questions or consistent selection of the first or last option presented in a question. As a result of these rigorous checks, two ATP respondents were excluded from the survey dataset prior to the weighting and analysis stages, further safeguarding the quality of the findings.
Weighting: Balancing the Sample
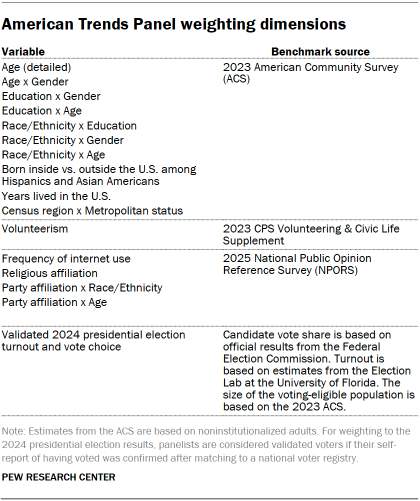
The weighting process for the ATP data is a sophisticated, multi-stage procedure designed to correct for various forms of sampling and nonresponse bias that can occur throughout the panel survey lifecycle. Each panelist begins with a base weight that reflects their initial probability of being recruited into the panel. These base weights are then adjusted through calibration to align with established population benchmarks. This calibration corrects for nonresponse during the initial recruitment surveys and for panel attrition over time.
If only a specific subsample of panelists was invited to participate in a particular wave, as was the case for Wave 185 (sampled from Wave 183 respondents), the weights are further adjusted to account for any differential selection probabilities within that subsample. Additionally, because respondents for Wave 185 were drawn from those who completed Wave 183, the weights were adjusted to account for nonresponse that occurred in Wave 183.
The final weighting stage involves calibrating the weights again to align with the population benchmarks detailed in accompanying tables. To mitigate the loss of precision that can arise from extreme weight values, the weights are trimmed at the 1st and 99th percentiles. This ensures that while the sample accurately reflects population demographics, the influence of any single outlier response is minimized. Statistical significance tests and the calculation of sampling errors are conducted with full consideration of the effects of this weighting procedure.
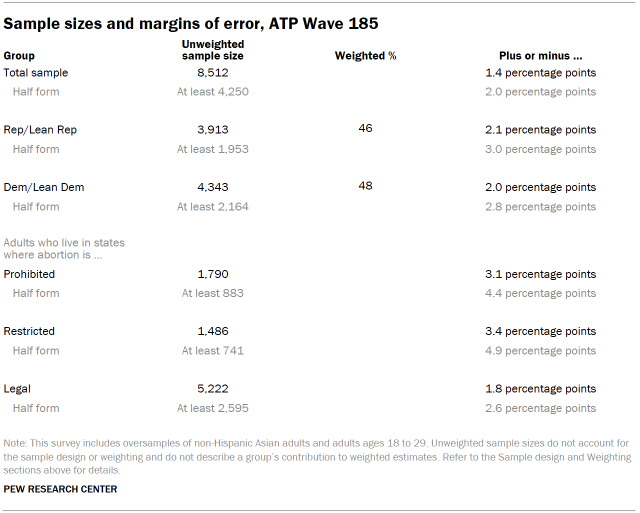
The provided tables illustrate the unweighted sample sizes and the expected margins of error at a 95% confidence level for various demographic groups within the survey. For instance, the margin of sampling error for the full sample of 8,512 respondents is plus or minus 1.4 percentage points. This margin of error is crucial for interpreting the precision of survey findings. Sample sizes and corresponding sampling errors for other specific subgroups are available upon request, offering a deeper dive into the data’s granularity. It is also important to acknowledge that beyond sampling error, other factors such as the precise wording of survey questions and practical challenges inherent in survey administration can introduce potential errors or biases into the results.
Dispositions and Response Rates: A Detailed Picture
The final disposition of sampled panelists and the calculated response rates provide a transparent view of the survey’s reach and engagement. The detailed tables offer a breakdown of how each sampled individual was categorized, including completed interviews, refusals, non-contacted individuals, and other disposition codes. These figures are essential for understanding the overall success of the data collection effort and for calculating the various response rates that reflect different aspects of the survey process, from initial contact to final completion. The cumulative response rate, as noted earlier, accounts for the entire history of engagement with the panel, providing a comprehensive measure of panel stability and data collection efficiency over time.
The meticulous methodology employed by the American Trends Panel in Wave 185 highlights Pew Research Center’s dedication to producing high-quality, reliable data. The combination of advanced sampling techniques, comprehensive recruitment strategies, rigorous questionnaire design, thoughtful incentive structures, and sophisticated weighting procedures ensures that the panel remains a vital resource for understanding the complexities of American public opinion. The panel’s ability to oversample specific demographic groups and then appropriately weight them back into the overall sample is a key strength, allowing for detailed analysis of often-underrepresented communities while maintaining the integrity of national estimates. This commitment to methodological excellence provides a solid foundation for the insights derived from ATP surveys, making them indispensable for researchers, policymakers, and the public alike.