
Pew Research Center’s rigorous methodology for its American Trends Panel (ATP) survey, specifically Wave 190 conducted from March 23 to March 29, 2026, underscores a commitment to robust and representative public opinion data. This detailed examination of the survey’s design, recruitment, data collection, and weighting processes reveals the intricate steps taken to ensure the accuracy and reliability of findings that inform national discourse. With a substantial sample of 3,507 respondents out of 4,046 individuals sampled, the survey achieved a high survey-level response rate of 87%, a testament to its effective outreach and engagement strategies.
The foundation of the ATP lies in its ongoing effort to maintain a nationally representative panel of U.S. adults. This particular wave of data collection built upon a cumulative response rate of 3%, accounting for the complexities of initial recruitment and ongoing panel attrition. The survey design also prioritized precision for smaller demographic groups through an oversample of Muslim, Jewish, and non-Hispanic Asian adults. These groups, while representing smaller segments of the U.S. population, are crucial for a nuanced understanding of public opinion. Importantly, these oversampled groups are systematically weighted back to their correct population proportions, ensuring that the final results accurately reflect the broader American populace. The data was gathered through a dual-channel approach, with SSRS conducting the survey via online interviews (n=3,377) and live telephone interviews (n=130), accommodating diverse participant preferences and accessibilities. Interviews were conducted in both English and Spanish to further enhance inclusivity.
Panel Recruitment: A Strategic Approach to Building a Representative Sample
Since 2018, the American Trends Panel has relied on address-based sampling (ABS) as its primary recruitment method. This strategy involves mailing cover letters and pre-incentives to a stratified, random selection of households drawn from the U.S. Postal Service’s Computerized Delivery Sequence File, a file estimated to cover 90% to 98% of the U.S. population. Within each selected household, the adult with the next birthday is identified as the potential participant, a method designed to ensure randomness within the household. While the specifics of the ABS recruitment protocol have evolved over time, the core principle remains consistent: to establish a broad and representative base of adult participants. Prior to 2018, the ATP utilized random-digit-dial surveys conducted via landline and cellphone, administered in both English and Spanish.

The ATP has been actively recruiting a national sample of U.S. adults annually since 2014. To enhance the accuracy of data for underrepresented groups, specific recruitment efforts, termed "oversamples," have been implemented in various years. For instance, Hispanic adults were oversampled in 2019, Black adults in 2022, and Asian adults in 2023. These targeted recruitment drives are crucial for capturing the diverse perspectives within the American electorate and ensuring that smaller but significant demographic segments are adequately represented in survey findings.
Sample Design: Ensuring Proportionality and Precision
The target population for Wave 190 encompassed noninstitutionalized individuals aged 18 and older residing in the United States. The sample design employed a stratified random sample drawn from the ATP. A key feature of this design was the selection of Muslim, Jewish, and non-Hispanic Asian adults with certainty. This ensures that these subgroups, which are often smaller in absolute numbers within a randomly drawn sample, are sufficiently represented for meaningful analysis. For the remaining panelists, sampling rates were meticulously calibrated to maintain proportionality with their respective shares of the U.S. adult population, to the greatest extent feasible. The subsequent adjustment of respondent weights, detailed in a later section, plays a critical role in correcting for differential probabilities of selection.
Questionnaire Development and Testing: The Pursuit of Clarity and Accuracy
The integrity of survey data hinges on the quality of the questions asked. The questionnaire for Wave 190 was meticulously developed by Pew Research Center researchers in close collaboration with SSRS, the survey’s implementing partner. Rigorous testing of the online survey platform was a paramount step, conducted by both the SSRS project team and Pew Research Center researchers. This testing extended to various devices, including PCs and mobile phones, to ensure a seamless and error-free experience for online respondents. Furthermore, the SSRS team populated test data that was then analyzed using SPSS statistical software. This comprehensive pre-launch analysis verified the correct functioning of survey logic and randomizations, proactively identifying and rectifying any potential issues before the survey went live.
Incentives: Encouraging Participation Through Fair Compensation
Recognizing the value of respondents’ time and effort, all participants in Wave 190 were offered a post-paid incentive for their participation. This incentive was designed to be flexible, allowing respondents to choose between a check or a digital gift code redeemable at major online retailers such as Amazon.com, Target.com, or Walmart.com. The incentive amounts varied between $5 and $20, a differential structure intentionally implemented to acknowledge the varying difficulties in reaching certain population segments. This tiered incentive approach is a strategic tool employed to bolster survey participation rates, particularly among groups that have historically exhibited lower response propensities.
Data Collection Protocol: A Multi-Channel Approach to Maximizing Reach
The data collection period for this wave spanned from March 23 to March 29, 2026. The survey was administered through two primary channels: self-administered web surveys and live telephone interviewing.
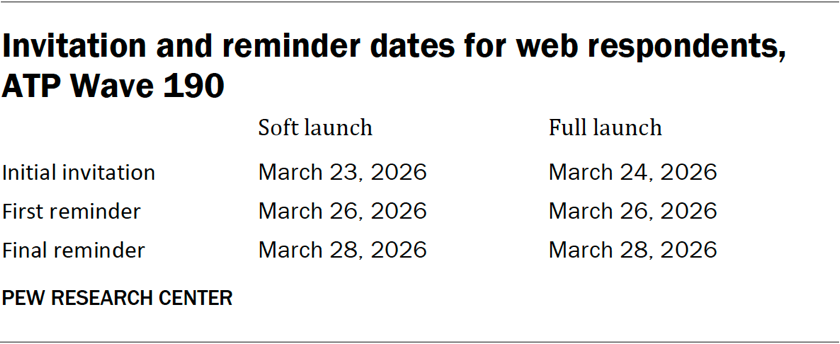
For online participants, the process began with postcard notifications mailed to a subset of panelists on March 23. The survey invitations were strategically rolled out in two phases: a soft launch and a full launch. The soft launch, initiated on March 23, included sixty panelists to test the survey flow and identify any immediate issues. Subsequently, on March 24, all remaining English- and Spanish-speaking sampled online panelists received their invitations as part of the full launch. Online respondents received an email invitation, and if they did not complete the survey, they were sent up to two email reminders. For panelists who had consented to receive SMS messages, an SMS invitation with a direct survey link was sent, followed by up to two SMS reminders.
A visual representation of the invitation and reminder schedule for web respondents in ATP Wave 190 highlights the structured approach to engagement.
For panelists opting for telephone interviews with a live interviewer, prenotification postcards were dispatched on March 20. A soft launch commenced on March 23, involving targeted dialing until three completed interviews were secured. Following this initial phase, telephone numbers for all remaining English- and Spanish-speaking sampled phone panelists were dialed throughout the remainder of the field period. To maximize completion rates and provide ample opportunity for participation, panelists who took the survey via phone could receive up to six calls from trained SSRS interviewers.
Data Quality Checks: Upholding the Integrity of the Dataset
Maintaining the highest standards of data quality is a cornerstone of Pew Research Center’s methodology. To this end, researchers conducted thorough data quality checks specifically designed to identify any respondents exhibiting patterns of satisficing—behavior where respondents provide superficial or unengaged answers. This included scrutinizing response patterns for unusually high rates of unanswered questions or a consistent selection of the first or last answer option presented. As a direct result of these stringent checks, five ATP respondents were excluded from the survey dataset prior to the weighting and analysis phases, ensuring that the final findings are based on engaged and thoughtful participation.
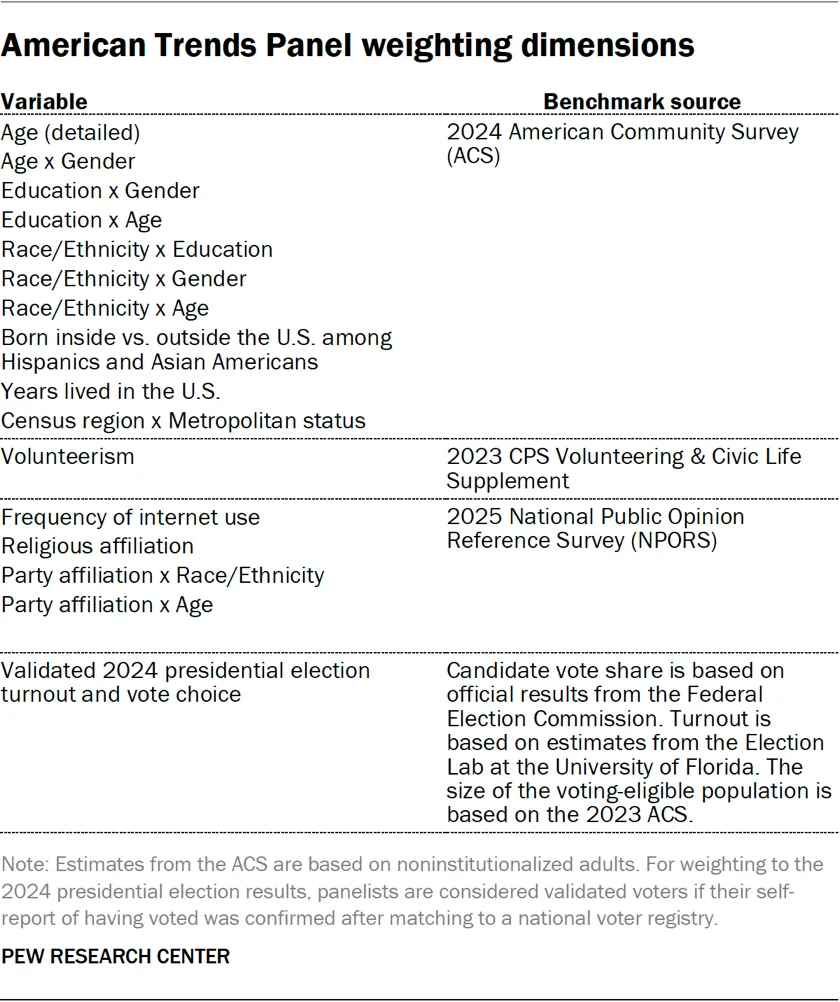
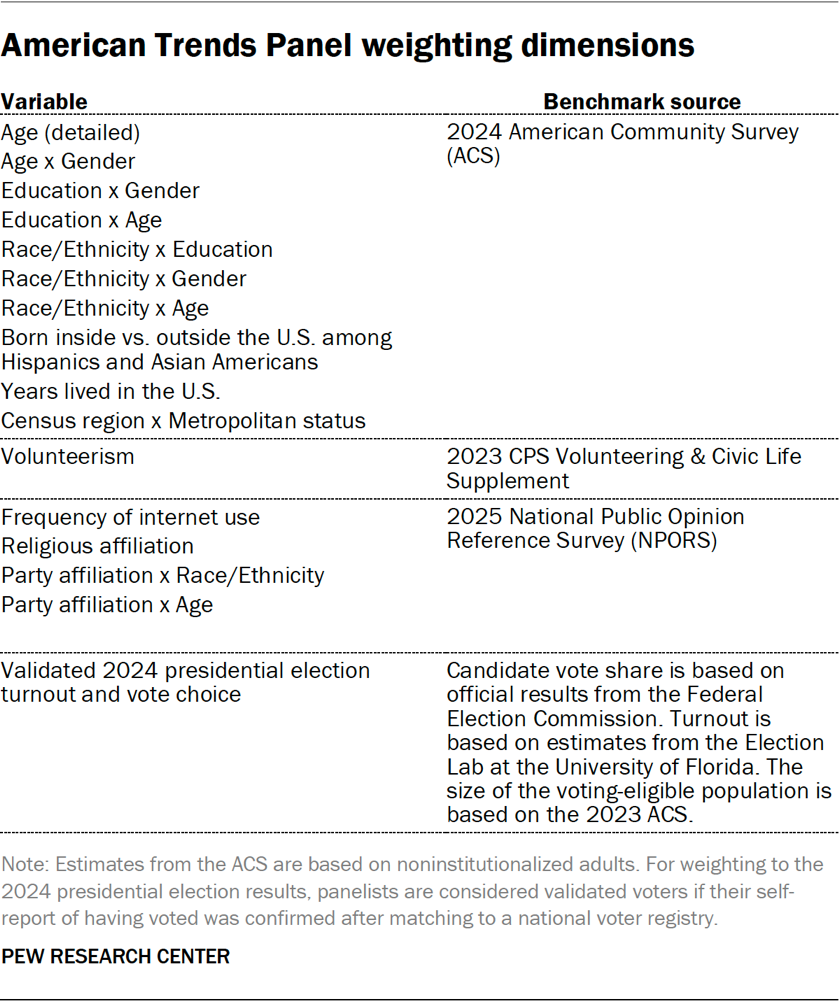
Weighting: Adjusting for Representation and Nonresponse
The process of weighting is fundamental to transforming the raw survey data into a representative snapshot of the U.S. adult population. The ATP employs a multi-stage weighting procedure that meticulously accounts for various stages of sampling and nonresponse that occur throughout the panel survey lifecycle. Initially, each panelist is assigned a base weight that reflects their probability of being recruited into the panel. These base weights are then adjusted and calibrated to align with established population benchmarks, thereby correcting for nonresponse during recruitment surveys and for attrition within the panel over time. If a specific wave of the survey only involved a subsample of panelists, the weights are further adjusted to account for any differential selection probabilities within that subsample.
Following the completion of the survey, the weights are recalibrated once more to align with population benchmarks relevant to the specific wave’s data. To mitigate potential loss of precision due to extreme weight values, weights are trimmed at the 1st and 99th percentiles. This rigorous weighting process ensures that the final analysis accurately reflects the demographic composition and characteristics of the U.S. adult population, while also accounting for the complexities of panel maintenance. The margin of sampling error, along with tests of statistical significance, are calculated with careful consideration of the impact of this weighting procedure.
A table illustrating the American Trends Panel weighting dimensions provides a detailed breakdown of the demographic and geographic factors used in this calibration process.
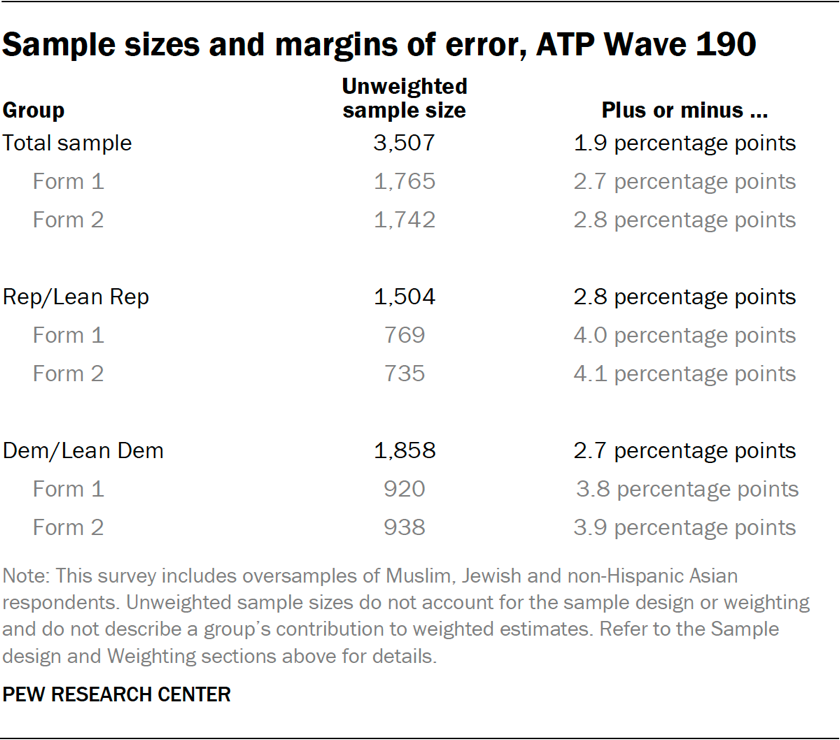
The subsequent table offers the unweighted sample sizes and the associated sampling errors expected at a 95% confidence level for various demographic groups within the survey. These figures are crucial for understanding the precision of estimates for different segments of the population.
While sample sizes and sampling errors for other demographic subgroups are available upon request, it is important to acknowledge that beyond sampling error, potential biases can arise from question wording and practical challenges inherent in conducting any survey.
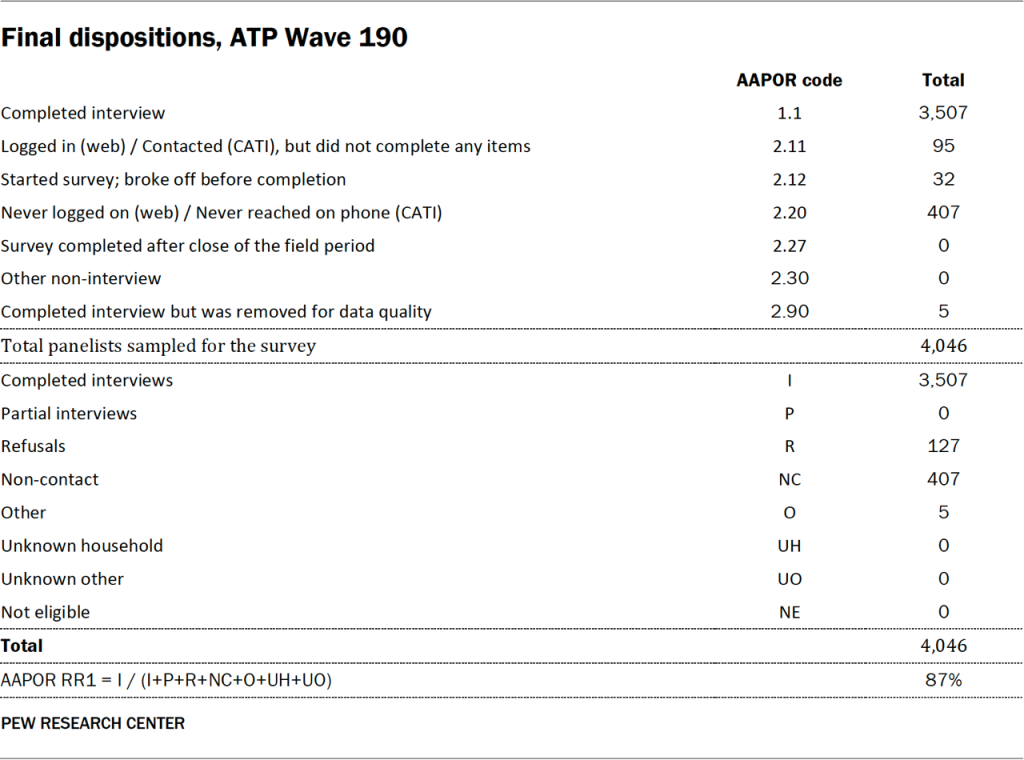
Dispositions and Response Rates: Tracking Panel Engagement
The final dispositions of the sampled individuals and the cumulative response rates provide a comprehensive overview of the panel’s engagement and the overall success of the data collection effort for Wave 190. These figures are critical for assessing the representativeness and reliability of the survey’s outcomes.
A detailed table outlining the final dispositions for ATP Wave 190 offers a granular view of how each sampled individual was categorized, from completed interviews to refusals and ineligibles.
Complementing this, a table presenting the cumulative response rate for ATP Wave 190 offers a broader perspective on the panel’s sustained engagement and the overall efficiency of the recruitment and data collection processes over time. These metrics collectively underscore the methodological rigor and commitment to transparency that define Pew Research Center’s public opinion surveys.


