
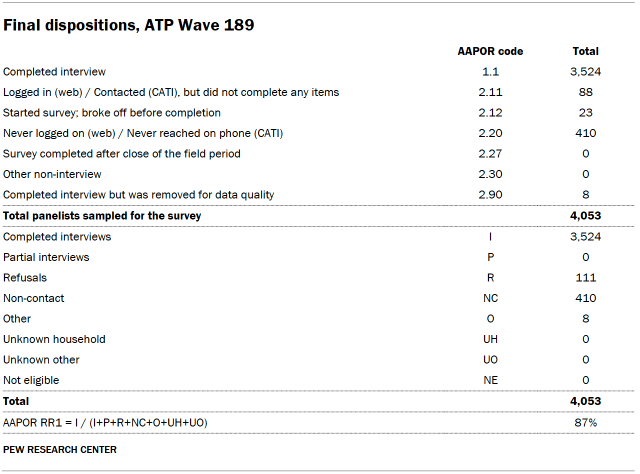
Pew Research Center’s commitment to rigorous and transparent data collection is exemplified by the methodology employed for Wave 189 of the American Trends Panel (ATP). This nationally representative survey, conducted from March 16 to March 22, 2026, offers a detailed look into the opinions and experiences of U.S. adults. The survey’s robust design and execution underscore Pew Research Center’s dedication to providing reliable insights into public opinion, a critical component for informed discourse and policy development in the United States. A total of 3,524 panelists responded to the survey out of 4,053 who were sampled, achieving a survey-level response rate of 87%. This high response rate, coupled with a minimal break-off rate of 1% among those who logged on and completed at least one item, indicates a engaged and committed panel.
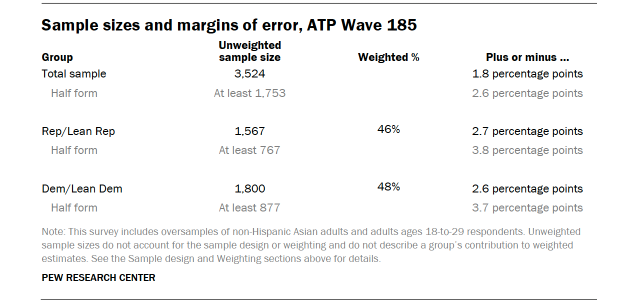
The comprehensive methodology of ATP Wave 189 was designed to ensure the highest degree of accuracy and representativeness. The panel itself is a cornerstone of Pew Research Center’s data collection efforts, comprising randomly selected U.S. adults who have agreed to participate in ongoing surveys. This longitudinal approach allows for tracking trends over time and understanding shifts in public sentiment with greater precision. The specific wave under review, Wave 189, was meticulously planned and executed to capture a snapshot of American perspectives during a period of evolving societal and political landscapes. The survey’s margin of sampling error for the full sample of 3,524 respondents is plus or minus 1.8 percentage points, a standard measure of statistical confidence in the findings.

A notable aspect of the ATP methodology is its commitment to inclusivity and accurate representation of diverse populations. For Wave 189, the survey included an oversample of non-Hispanic Asian adults. This strategic decision is crucial for providing more precise estimates of the opinions and experiences of this demographic subgroup, which is often smaller in national samples. By oversampling, Pew Research Center ensures that the voices and perspectives of minority groups are adequately captured and analyzed, preventing their underrepresentation from skewing overall findings. It is important to note that these oversampled groups are weighted back to reflect their correct proportions in the broader U.S. population, thereby maintaining the overall generalizability of the results.
The operational execution of the survey was managed by SSRS, a research firm with extensive experience in survey methodology, on behalf of Pew Research Center. The data collection employed a mixed-mode approach, utilizing both online (n=3,383) and live telephone (n=141) interviewing. This dual-pronged strategy aims to maximize participation by catering to different technological preferences and access levels among the adult population. Interviews were conducted in both English and Spanish, further enhancing the survey’s reach and ensuring that language barriers do not impede participation. For those interested in a deeper understanding of the ATP’s operational framework, Pew Research Center provides extensive documentation, including a dedicated section titled "About the American Trends Panel."
Panel Recruitment: Building a Representative Foundation
The foundation of the American Trends Panel’s representativeness is built upon its sophisticated recruitment process. Since 2018, the ATP has primarily utilized address-based sampling (ABS) for its recruitment efforts. This method involves mailing a study cover letter and a pre-incentive to a stratified, random sample of households. These households are selected from the U.S. Postal Service’s Computerized Delivery Sequence File, a comprehensive database estimated to cover 90% to 98% of the U.S. population. Within each sampled household, the adult who has the next birthday is designated as the potential participant. This method ensures a systematic and unbiased selection of individuals within a household, thereby contributing to the panel’s overall demographic accuracy. While the core ABS protocol has remained consistent, specific details of the recruitment process have evolved over time and are available upon request.
Prior to 2018, the ATP’s recruitment relied on traditional landline and cellphone random-digit-dial surveys, also administered in English and Spanish. This evolution to ABS reflects a strategic adaptation to changing communication landscapes and an ongoing effort to enhance the quality and reach of the panel. Since 2014, a national sample of U.S. adults has been recruited to the ATP approximately once per year. In certain years, this recruitment has been augmented with additional efforts, known as “oversamples,” specifically targeting underrepresented groups. For instance, Hispanic adults, Black adults, and Asian adults were oversampled in 2019, 2022, and 2023, respectively, demonstrating a proactive approach to ensuring demographic parity in the panel’s composition.
Sample Design: Precision and Proportionality
The sample design for ATP Wave 189 was carefully constructed to ensure that the survey’s findings accurately reflect the diverse population of the United States. The overall target population for this survey comprised noninstitutionalized individuals aged 18 and older residing in the U.S. The sample was drawn as a stratified random sample from the existing ATP panel. A key feature of this design was the selection of non-Hispanic Asian adults with certainty, reflecting the oversampling strategy implemented for this wave. The remaining panelists were sampled at rates meticulously calibrated to ensure that the proportion of respondents within each stratum was as close as possible to their proportion in the overall U.S. adult population. This sophisticated weighting process, detailed further in the Weighting section, is critical for adjusting for differential probabilities of selection and ensuring that the final sample is representative.
Questionnaire Development and Testing: Ensuring Clarity and Accuracy
The integrity of survey data hinges on the quality of the questions asked. For ATP Wave 189, the questionnaire was developed collaboratively by Pew Research Center researchers and SSRS, leveraging their combined expertise in survey design and public opinion research. The development process was iterative and rigorous, involving extensive consultation to ensure that questions were clear, unambiguous, and relevant to the research objectives.
Following questionnaire design, the online survey instrument underwent comprehensive testing. The SSRS project team and Pew Research Center researchers meticulously tested the web program across various platforms, including both PC and mobile devices. This thorough testing ensured the survey’s functionality, user experience, and compatibility across different technological environments. Furthermore, the SSRS project team populated test data that was analyzed using SPSS. This critical step verified the survey’s logic and randomizations, ensuring that the data collected would be accurate and that the survey flowed as intended before its official launch. This commitment to pre-launch testing is a vital safeguard against technical errors and questionnaire-related biases.
Incentives: Encouraging Participation
To foster higher participation rates and acknowledge the time and effort of panelists, respondents were offered a post-paid incentive for their participation in Wave 189. Participants had the flexibility to choose their incentive in the form of a check or a digital gift code redeemable at major online retailers such as Amazon.com, Target.com, or Walmart.com. The value of these incentives ranged from $5 to $15, with the amount determined by how easily a respondent could be reached within the population. This differential incentive structure is a strategic tool employed by Pew Research Center to encourage participation from groups that historically exhibit lower survey response propensities, thereby enhancing the representativeness of the panel.
Data Collection Protocol: A Multi-faceted Approach
The data collection for ATP Wave 189 was conducted over a defined field period from March 16 to March 22, 2026. The surveys were administered through two primary channels: self-administered web surveys and live telephone interviews.
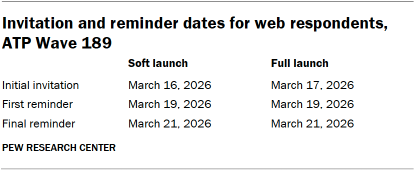
For panelists who participate online, a multi-stage invitation and reminder process was implemented. Postcard notifications were mailed to a subset of online panelists on March 16. The survey invitations were then distributed in two phases: a soft launch and a full launch. The soft launch, which began with an initial invitation sent on March 16, included sixty panelists. This controlled release allowed for final checks of the online survey system. Following the soft launch, all remaining English- and Spanish-speaking sampled online panelists were included in the full launch, receiving their invitations on March 17. Panelists participating online received an email invitation and up to two email reminders if they had not yet completed the survey. For those who had consented to receive SMS messages, an SMS invitation with a direct link to the survey was sent, followed by up to two SMS reminders.
For panelists who opt for telephone interviews with a live interviewer, a similar prenotification strategy was employed. Prenotification postcards were mailed on March 13. The data collection for phone participants also included a soft launch on March 16, during which dialing commenced until a total of nine interviews were successfully completed. Subsequently, the phone numbers of all remaining English- and Spanish-speaking sampled phone panelists were dialed throughout the remainder of the field period. To ensure adequate opportunity for participation, panelists contacted via phone could receive up to six calls from trained SSRS interviewers. This systematic approach to data collection, across both online and phone modalities, is designed to maximize response rates while minimizing potential biases.
Data Quality Checks: Upholding Integrity
Maintaining the integrity of the collected data is paramount. Pew Research Center researchers implemented robust data quality checks to identify and address any patterns of satisficing among respondents. Satisficing refers to respondents who provide satisfactory, rather than optimal, answers, which can occur due to fatigue, lack of engagement, or other factors. These checks included scrutinizing response patterns, such as whether respondents left an unusually high number of questions blank or consistently selected the first or last answer option presented. As a direct outcome of these meticulous checks, eight ATP respondents were excluded from the survey dataset prior to the weighting and analysis stages. This proactive measure ensures that the data used for reporting is as clean and reliable as possible, bolstering the accuracy of the survey’s conclusions.
Weighting: Ensuring Representativeness
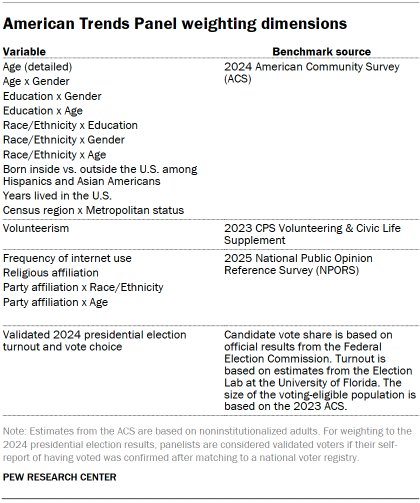
The weighting process for the American Trends Panel data is a sophisticated, multi-stage procedure designed to account for the complexities of panel surveys, including differential probabilities of selection and nonresponse that occur at various points in the research process. Each panelist begins with a base weight that reflects their initial probability of being recruited into the panel. These base weights are then calibrated to align with established population benchmarks, as detailed in accompanying tables. This calibration step is crucial for correcting any nonresponse bias that may have occurred during the recruitment surveys and to mitigate the effects of panel attrition over time. If a particular wave of the survey involves inviting only a subsample of panelists, the weights are further adjusted to account for any differential selection probabilities within that specific wave.
The calibration process is repeated for panelists who complete the survey. This second calibration adjusts the weights to align with the population benchmarks identified in the accompanying tables. To minimize any potential loss of precision that might arise from extreme weight values, the weights are trimmed at the 1st and 99th percentiles. This trimming ensures that the influence of any outlier weights is reduced, leading to more stable and reliable estimates. Crucially, the sampling errors and tests of statistical significance are calculated to take into account the effect of this complex weighting procedure, ensuring that measures of uncertainty accurately reflect the survey’s design and data processing.
The accompanying tables provide essential information regarding sample sizes and the margins of error associated with the data. One table details the unweighted sample sizes and the expected sampling error at a 95% confidence level for various demographic groups included in the survey. Another table presents the final dispositions of the sampled individuals, categorizing them by their participation status (e.g., completed interviews, refusals, ineligibles). A third table illustrates the cumulative response rate, offering a comprehensive view of the panel’s overall engagement and retention. These detailed tables are indispensable for researchers and the public seeking to understand the statistical reliability and scope of the survey findings. It is also important to acknowledge that, in addition to sampling error, other factors such as question wording and practical challenges inherent in conducting surveys can introduce error or bias into the findings of opinion polls. Therefore, a holistic understanding of potential limitations is always recommended when interpreting survey results.


