
Approximately 1.7 million individuals in the United States trace their heritage to the indigenous peoples of Hawaii, Guam, Samoa, and other Pacific Islands, constituting 0.5% of the nation’s population. This diverse demographic, often grouped under the broader "Asian American and Pacific Islander" category, possesses unique histories, cultures, and experiences that warrant specific attention, particularly as May is recognized as Asian/Pacific American Heritage Month. A comprehensive analysis by the Pew Research Center, drawing on data primarily from the U.S. Census Bureau’s 2024 American Community Survey (ACS) and earlier decennial censuses, illuminates the demographic, social, and economic landscape of Native Hawaiians and Pacific Islanders (NHPIs) residing in the 50 states and the District of Columbia.
The study underscores the significant growth of the NHPI population, which has nearly doubled since the year 2000. Between 2000 and 2024, the NHPI population in the continental U.S. and D.C. surged by 94%, from approximately 875,000 to 1.7 million. This growth rate far outpaces that of the overall U.S. population, which saw a 21% increase during the same period. This expansion is notably fueled by an increase in individuals identifying as NHPI and at least one other race. The multiracial NHPI population grew by 119% from 2000, while the single-race NHPI population increased by 64%. This trend aligns with a broader national pattern of rising multiracial identification across various demographic groups.

Historical Context and U.S. Ties to the Pacific
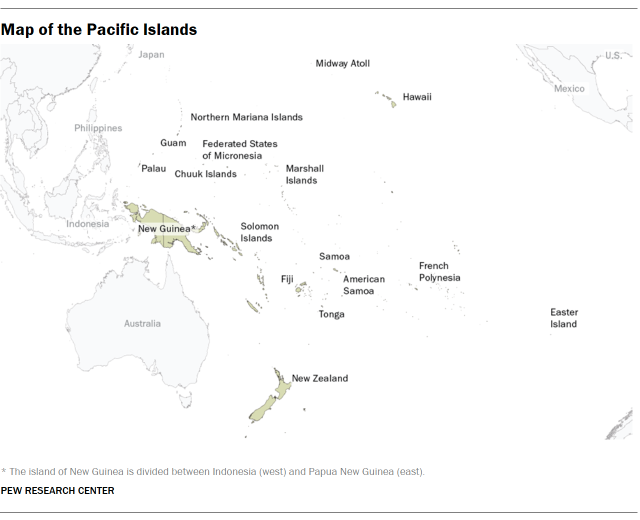
The relationship between the United States and the Pacific Islands is deeply rooted in historical political, economic, and military engagements. The U.S. acquired several Pacific Islands at the turn of the 20th century through various means, including cession after the Spanish-American War (Guam) and the controversial overthrow of the Hawaiian monarchy in 1893, an act for which Congress later apologized. Hawaii became a U.S. territory in 1900 and a state in 1959. Today, Guam, American Samoa, and the Northern Mariana Islands are U.S. territories. Residents of these territories have varying degrees of U.S. citizenship and political representation. Furthermore, citizens of the Freely Associated States—Palau, the Federated States of Micronesia, and the Marshall Islands—hold the right to live and work in the U.S. under specific agreements, reflecting ongoing strategic partnerships. Understanding these historical ties is crucial for comprehending the contemporary presence and identity of NHPIs within the United States.
Demographic Shifts and Origin Groups
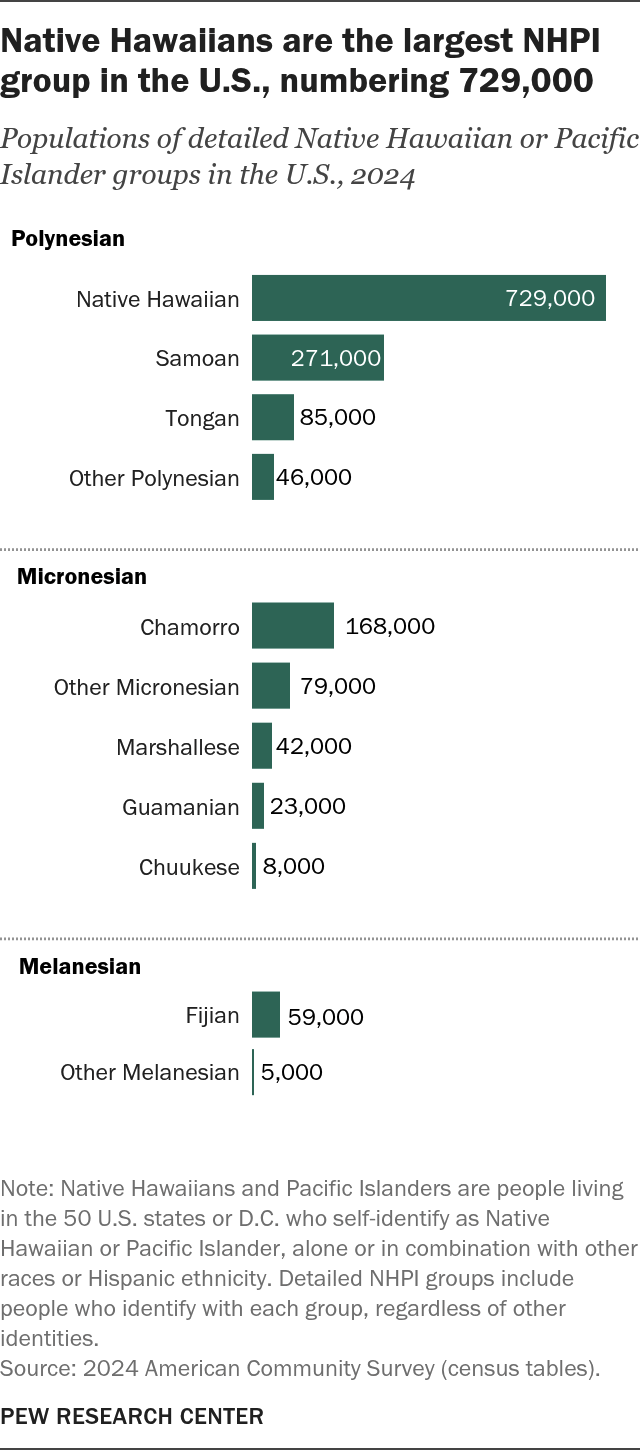
The NHPI population is characterized by its diverse origins within Oceania. The Census Bureau categorizes these origins into three main regions: Polynesia, Micronesia, and Melanesia. Individuals of Polynesian descent form the largest segment of the NHPI population in the U.S., followed by those of Micronesian and Melanesian origin. Native Hawaiians represent the largest single origin group, accounting for 43% of the total NHPI population in 2024, with approximately 729,000 individuals. Samoans constitute the second-largest group with 271,000 individuals, followed by Chamorros (originating from the Mariana Islands) at 168,000. An additional 270,000 individuals identified as NHPI without specifying a detailed origin.
The dynamic nature of identity is evident in the increasing prevalence of multiracial identification among NHPIs. By 2024, 61% of NHPIs identified with two or more races, a figure significantly higher than the 13% observed for the U.S. population overall. This multiracial identification is more pronounced among Native Hawaiians (74%) compared to Pacific Islanders (53%). Furthermore, 18% of NHPIs identify as Hispanic, a figure comparable to the national average.
Geographic Distribution and Migration Patterns
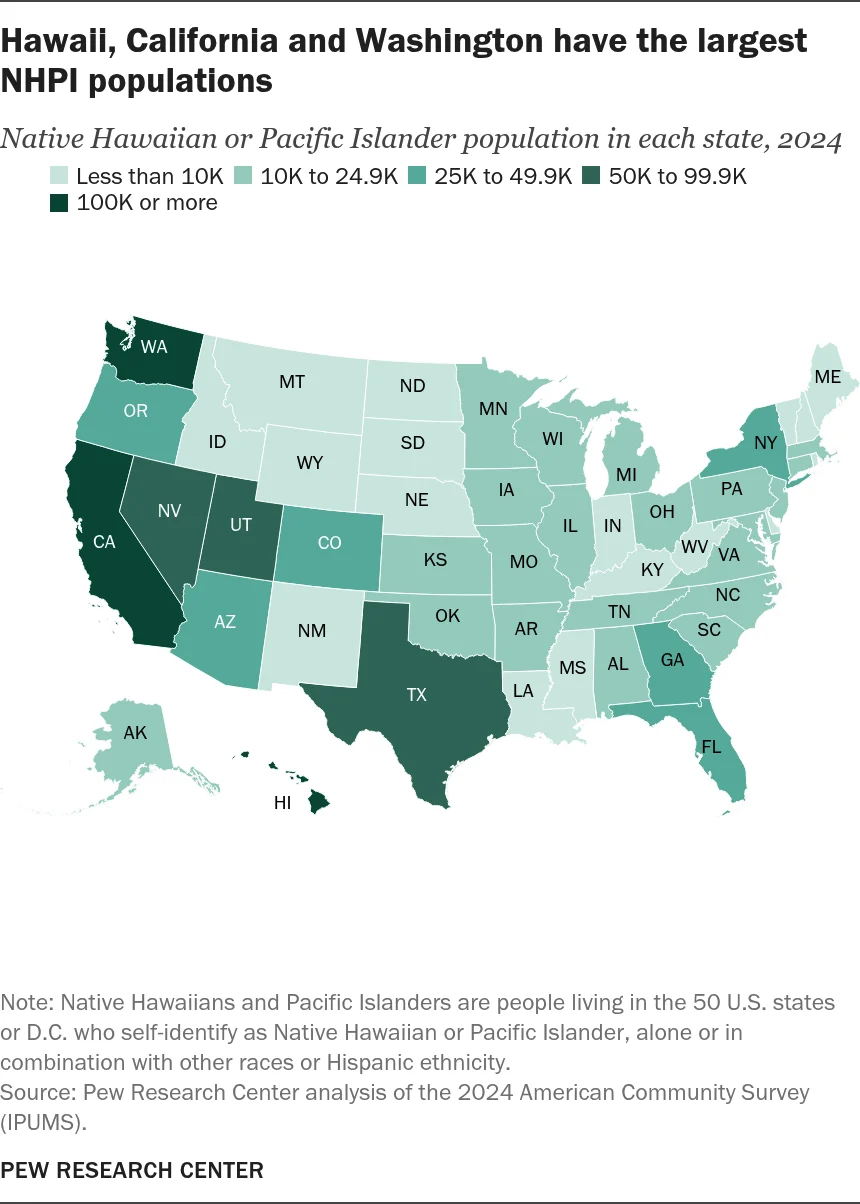
While Hawaii remains a significant hub for NHPIs, a growing majority now reside in the continental United States. In 2024, 55% of Native Hawaiians lived in the continental U.S., a reversal from 2012 when 55% resided in Hawaii. This trend reflects broader patterns of migration and the dispersion of communities across the nation. After Hawaii, California, Washington, and Texas host the largest NHPI populations. The Honolulu metropolitan area has the highest concentration of NHPIs, representing 26% of its total population. Other major metropolitan areas with substantial NHPI communities include Los Angeles and Seattle.
The birthplace of NHPIs living in the U.S. also highlights diverse origins. The majority were born in a U.S. state or territory, with 52% born in the continental U.S. and 27% in Hawaii. However, a notable portion, 14%, were born outside U.S. jurisdictions, including Pacific Island nations (6%) and other foreign countries (8%). Native Hawaiians are predominantly born in Hawaii or the continental U.S., whereas Pacific Islanders exhibit a wider range of birthplaces, including U.S. Pacific Island territories and other Pacific Island nations.
Age Demographics and Social Characteristics
Native Hawaiians and Pacific Islanders are a considerably younger demographic compared to the overall U.S. population. In 2024, the median age for NHPIs was 30.3 years, significantly lower than the national median age of 39.2 years. This youthfulness is reflected in the proportion of individuals under 18, which stands at 31% for NHPIs, compared to 21% for all Americans. Multiracial NHPIs tend to be younger than their single-race counterparts, with a median age of 28.0 compared to 33.0.

Intermarriage rates among NHPIs are notably high. In 2024, 59% of married NHPI adults were in intermarriages, a rate comparable to American Indian and Alaska Native adults. This contrasts with lower intermarriage rates observed among other racial and ethnic groups, such as Hispanic adults (35%) and Asian adults (31%). This high rate of intermarriage contributes to the increasing prevalence of multiracial identification within the NHPI community.
Educational Attainment and Economic Standing
The educational landscape for NHPIs shows a steady upward trend, though it still lags behind the national average. In 2024, 27% of NHPI adults aged 25 and older held a bachelor’s degree or higher, an increase from 17% in 2000. Despite this progress, the gap in college attainment between NHPIs and the overall U.S. adult population has slightly widened, with 37% of all U.S. adults holding a bachelor’s degree or higher. Multiracial NHPIs demonstrate higher educational attainment (32%) compared to single-race NHPIs (20%).

Economically, NHPI households reported a median annual income of $93,600 in 2024, closely mirroring the national median household income of $95,300. However, within Hawaii, NHPI households earned a median income of $100,000, which was lower than the state’s overall median household income of $112,200. Detailed analyses of poverty rates, personal earnings, and homeownership are available in supplementary data, offering a more granular view of the economic well-being of the NHPI population.
Political Affiliations and Electorate Growth
Recent data from 2023-2024 indicates that NHPI adults are nearly evenly divided in their political party affiliations, with roughly equal proportions identifying as Republican or Democratic. A smaller segment, about 10%, does not affiliate with or lean toward either major party. These figures are not statistically different from the overall U.S. adult population’s political identification. However, the NHPI electorate is growing. In 2024, approximately 1.1 million NHPIs were eligible to vote in the 50 states and D.C., a significant increase from 473,000 in 2000. This growing demographic presence suggests an increasing influence on the U.S. political landscape.

The Pew Research Center’s comprehensive analysis provides a vital snapshot of the Native Hawaiian and Pacific Islander population in the United States, highlighting their growth, diversity, unique identities, and contributions to the nation’s social and cultural fabric. By disentangling NHPI data from broader pan-ethnic categories, this research offers crucial insights for policymakers, community leaders, and the public to better understand and support these distinct and dynamic communities.


