
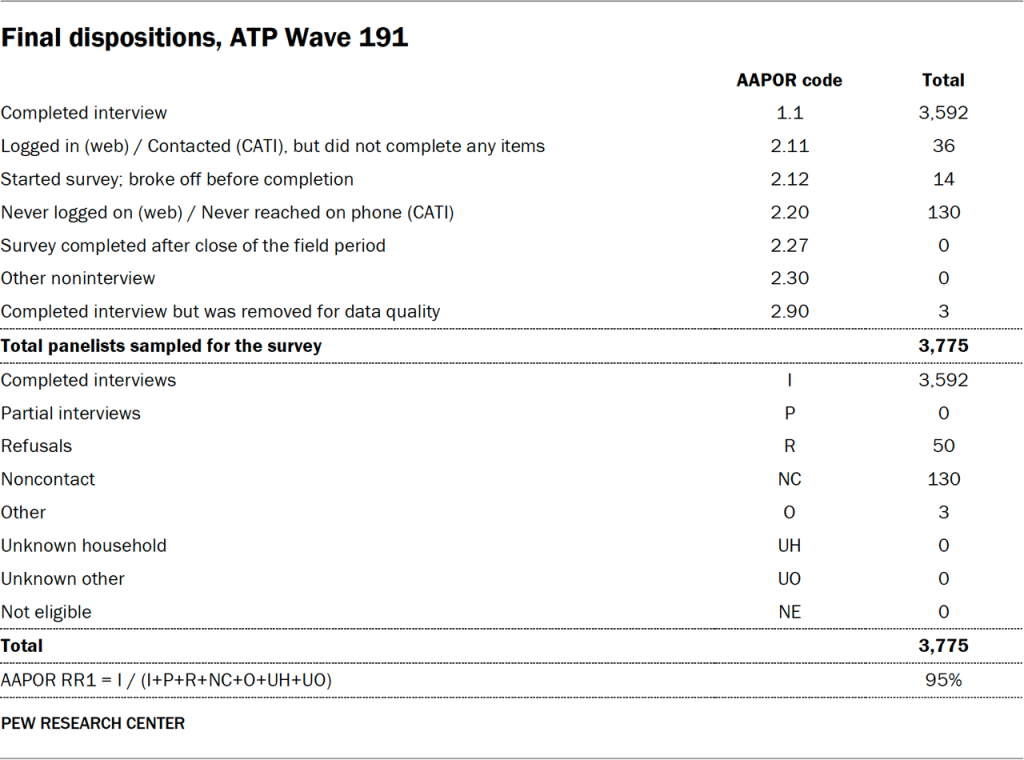
Pew Research Center’s latest report, detailing findings from Wave 191 of the American Trends Panel (ATP), offers a comprehensive look at the rigorous methodology employed to gather nationally representative data from U.S. adults. The survey, conducted between April 6th and April 12th, 2026, engaged a substantial cohort of 3,592 panelists who responded out of an initial sample of 3,775, achieving a robust survey-level response rate of 95%. This high participation rate underscores the efficacy of the ATP’s established protocols for data collection and panel management.
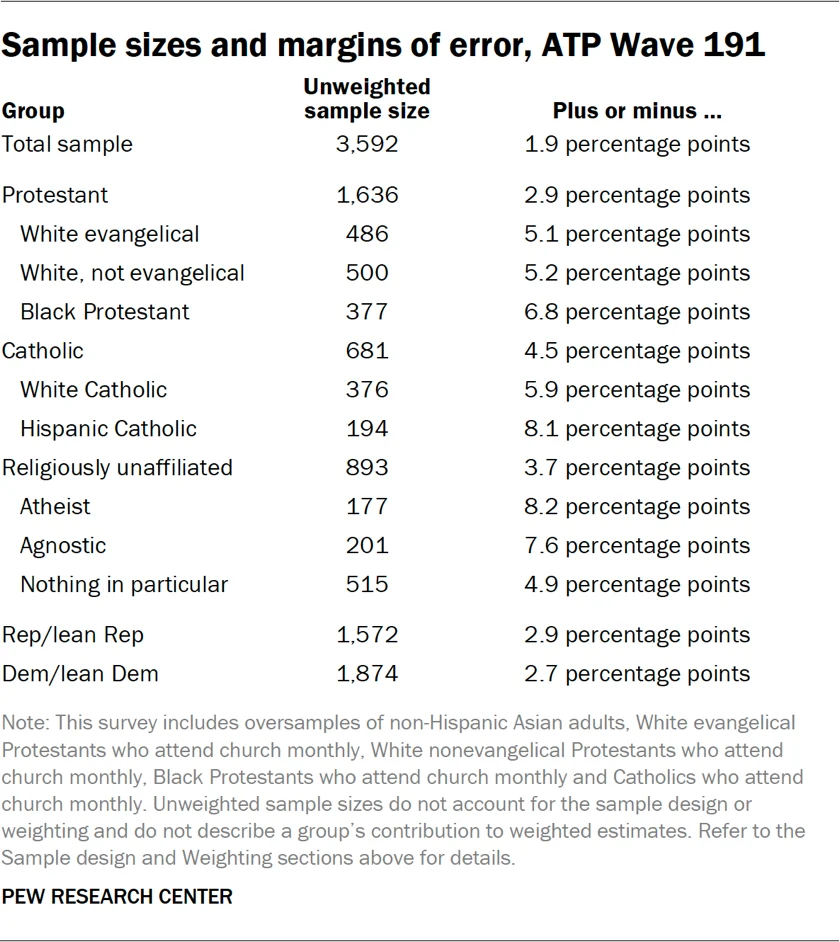
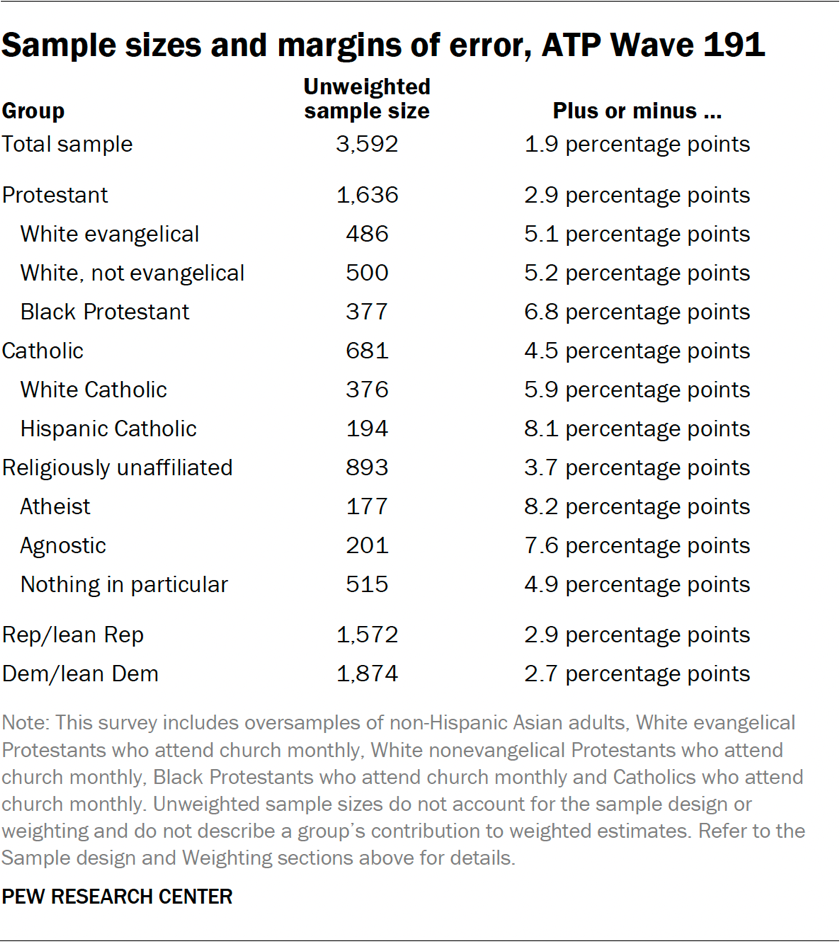
The cumulative response rate, which accounts for initial recruitment survey nonresponse and ongoing panel attrition, stands at 3%. This figure, while appearing low, is a standard metric in longitudinal panel studies where maintaining a consistent, representative group over time presents inherent challenges. The break-off rate among panelists who began the survey and completed at least one item was commendably low, falling below 1%, indicating a high level of engagement with the survey content itself. For the full sample of 3,592 respondents, the margin of sampling error at the 95% confidence level is plus or minus 1.9 percentage points, a standard measure of precision in survey research.
A critical aspect of the ATP methodology is its strategic use of oversampling. This technique is employed to ensure sufficient sample sizes for specific demographic and religious subgroups, thereby enabling more precise estimates of their opinions and experiences. In Wave 191, oversamples were specifically targeted for non-Hispanic Asian adults, White evangelical Protestants who attend church monthly, White non-evangelical Protestants who attend church monthly, Black Protestants who attend church monthly, and Catholics who attend church monthly. It is crucial to note that these oversampled groups are subsequently weighted back to their correct proportions within the overall population to maintain national representativeness in the final analysis. This ensures that the findings accurately reflect the broader U.S. adult population while still allowing for detailed insights into these important, often smaller, segments.

The data collection for Wave 191 was a collaborative effort between SSRS and Pew Research Center, utilizing a dual-mode approach that combined online interviewing for the vast majority of respondents (n=3,491) with live telephone interviews for a smaller subset (n=101). This mixed-mode strategy is designed to maximize reach and accommodate diverse respondent preferences and access to technology. Interviews were conducted in both English and Spanish, further enhancing the inclusivity and representativeness of the data. For those interested in a deeper understanding of the ATP’s operational framework, Pew Research Center provides extensive documentation on its website, detailing its long-term commitment to high-quality survey research.
Panel Recruitment and Evolution
The foundation of the American Trends Panel’s reliability lies in its sophisticated recruitment strategy. Since 2018, the ATP has predominantly employed address-based sampling (ABS) for recruiting new panelists. This method involves mailing a study cover letter and a pre-incentive to a stratified, random sample of households selected from the U.S. Postal Service’s Computerized Delivery Sequence File. This file is estimated to cover between 90% and 98% of U.S. households, providing a broad reach. Within each sampled household, the adult who has the next birthday is identified as the potential participant. While the specifics of the ABS recruitment protocol have evolved since its implementation, the core principle of systematically selecting households and then individuals within them remains consistent.
Prior to 2018, the ATP relied on traditional landline and cellphone random-digit-dial (RDD) surveys, conducted in English and Spanish, for panel recruitment. The shift to ABS represents a strategic adaptation to changing communication landscapes and a commitment to capturing a more representative cross-section of the U.S. adult population, which increasingly relies on non-traditional phone services or has opted out of traditional landline access.
The ATP has undertaken national recruitment efforts approximately once per year since 2014. In select years, these recruitment drives have incorporated additional oversampling efforts. These targeted campaigns are specifically designed to bolster the representation of underrepresented groups within the panel. For instance, Hispanic adults were oversampled in 2019, Black adults in 2022, and Asian adults in 2023. This proactive approach to panel composition ensures that the ATP remains a valuable resource for studying the evolving demographics and opinions of the American populace.
Sample Design and Stratification
The target population for Wave 191 of the ATP survey comprised noninstitutionalized individuals aged 18 and older residing in the United States. The sample design was based on a stratified random sample drawn from the existing ATP panel. As previously noted, specific subgroups were intentionally oversampled: non-Hispanic Asian adults, White evangelical Protestants attending church monthly, White non-evangelical Protestants attending church monthly, Black Protestants attending church monthly, and Catholics attending church monthly.
For the remaining panelists, selection probabilities were carefully managed to ensure that the proportion of respondents within each stratum closely mirrored their representation in the broader U.S. adult population. This meticulous approach to sample design is foundational to achieving a representative dataset. The subsequent application of respondent weights, as detailed in the weighting section, further refines the sample to correct for any differential probabilities of selection that may arise during the recruitment and survey participation phases.
Questionnaire Development and Quality Assurance
The development of the survey questionnaire for Wave 191 was a collaborative process, spearheaded by Pew Research Center in consultation with SSRS. This iterative development ensures that questions are clear, unambiguous, and designed to elicit accurate and meaningful responses. Rigorous testing of the online survey instrument was conducted by both the SSRS project team and Pew Research Center researchers. This testing encompassed a variety of digital environments, including PCs and mobile devices, to ensure seamless user experience and data integrity across different platforms.
Furthermore, the SSRS project team populated test data that was thoroughly analyzed using statistical software (SPSS). This crucial step verified that all logical pathways and randomizations within the questionnaire were functioning as intended before the survey was deployed to the full panel. This commitment to pre-launch quality assurance is paramount in minimizing potential errors or biases stemming from questionnaire design or technical implementation.
Incentives and Data Collection Protocol
To foster high participation rates and acknowledge the valuable time contributed by panelists, all respondents were offered a post-paid incentive. Participants had the flexibility to choose their incentive in the form of a check or a digital gift code redeemable at major online retailers such as Amazon.com, Target.com, or Walmart.com. The incentive amounts varied, ranging from $5 to $15, with higher amounts allocated to panelists representing populations that are traditionally more challenging to reach or engage in survey research. This differential incentive strategy is a deliberate tactic to enhance survey participation among groups that may have historically exhibited lower response propensities, thereby improving the overall representativeness of the panel.
The data collection for Wave 191 occurred within a defined field period from April 6th to April 12th, 2026. Surveys were administered through two primary modes: self-administered online surveys and live telephone interviews.
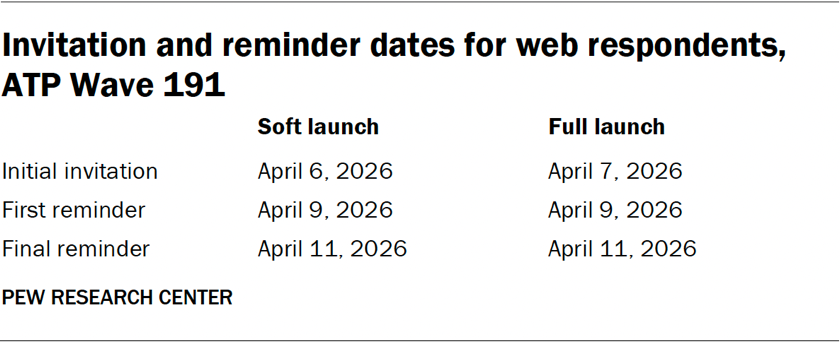
For panelists participating online, a staggered invitation process was employed. Postcard notifications were mailed to a subset of panelists on April 6th. The survey invitations were then launched in two phases: a soft launch and a full launch. The soft launch, commencing on April 6th, involved an initial invitation sent to approximately 60 panelists. This controlled rollout allows for final checks of the survey system and invitation process. Following the soft launch, all remaining English- and Spanish-speaking sampled online panelists received their invitations on April 7th as part of the full launch.
Panelists who opted for online participation received an email invitation. For those who did not respond, up to two email reminders were sent to encourage completion. Additionally, panelists who had previously consented to receive SMS messages were sent an SMS invitation containing a direct link to the survey, along with up to two SMS reminders.
For panelists who preferred or were selected for telephone surveys conducted by live interviewers, a distinct protocol was followed. Prenotification postcards were mailed on April 3rd. The soft launch for telephone interviews began on April 6th, with interviewers dialing until a total of five completed interviews were secured. Subsequently, the numbers of all remaining English- and Spanish-speaking sampled phone panelists were dialed throughout the remainder of the field period. Panelists participating via telephone could receive up to six calls from trained SSRS interviewers to maximize the chances of completing the interview.
Data Quality Checks and Respondent Screening
Pew Research Center is committed to ensuring the highest standards of data quality. Throughout the analysis phase, researchers conducted thorough data quality checks to identify any respondents who might exhibit patterns indicative of satisficing. Satisficing, in survey research, refers to respondents who provide adequate but not optimal answers, often due to fatigue, lack of engagement, or a desire to complete the survey quickly. Indicators of satisficing include unusually high rates of leaving questions blank, consistently selecting the first or last option presented in a series, or exhibiting very fast completion times that suggest a lack of careful consideration. As a result of these rigorous checks, three ATP respondents were excluded from the survey dataset prior to the weighting and analysis stages, thereby safeguarding the integrity of the findings.
Weighting Procedures for Representativeness
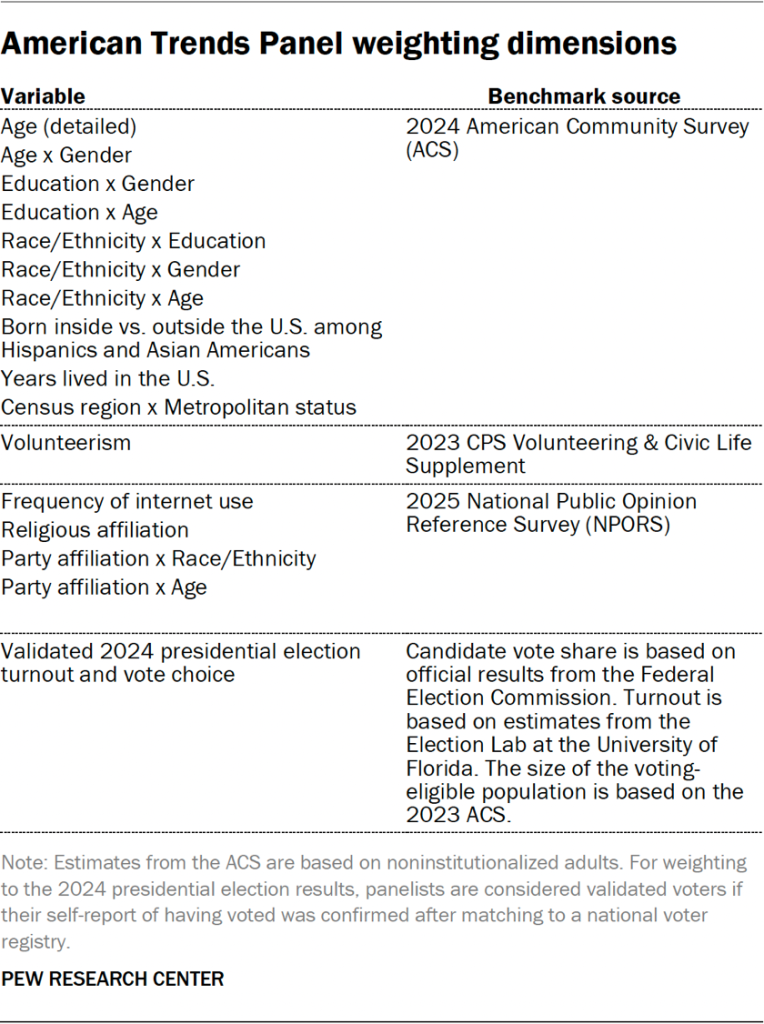
The weighting process for ATP data is a multi-stage operation designed to ensure that the final sample accurately reflects the demographic and attitudinal characteristics of the U.S. adult population. Each panelist begins with a base weight that accounts for their initial probability of being recruited into the panel. These base weights are then systematically adjusted through calibration to align with established population benchmarks. This calibration process corrects for nonresponse that occurs during the initial recruitment surveys and addresses panel attrition, which is the natural loss of participants over time.
If a specific wave of the survey only invited a subsample of the overall panel, the weights are further adjusted to account for any differential probabilities of selection associated with that particular subsample. This ensures that the weighted data accurately represents the intended target population.
Among the panelists who successfully completed the survey, their weights are once again calibrated to align with population benchmarks. This second calibration step is critical for ensuring that the final analytical sample mirrors the U.S. adult population on key demographic and behavioral characteristics. To mitigate the potential for extreme weights to disproportionately influence the results and to enhance the precision of the estimates, weights are trimmed at the 1st and 99th percentiles. This trimming process reduces the variance in the weights, leading to more stable and reliable statistical inferences. The sampling errors and tests of statistical significance are calculated taking into account the effects of this comprehensive weighting procedure.
The accompanying tables provide detailed information on sample sizes and the margins of error associated with different groups within the survey. These figures are crucial for understanding the precision of the estimates derived from the data. Sample sizes and sampling errors for additional subgroups not explicitly detailed can be made available upon request. Beyond sampling error, it is important to acknowledge that other factors, such as the specific wording of survey questions and practical challenges inherent in conducting survey research, can also introduce error or bias into the findings of opinion polls.
Dispositions and Response Rate Analysis
The final disposition of sampled panelists and the calculation of response rates are critical components in assessing the completeness and representativeness of the survey data. Detailed tables provide a clear breakdown of how each sampled individual was categorized throughout the data collection process. This includes information on contacted individuals, those who completed the survey, and reasons for nonresponse, such as refusals or ineligibility. The cumulative response rate, meticulously calculated to account for all stages of recruitment and panel maintenance, offers a holistic view of the panel’s representativeness over time. The high survey-level response rate of 95% for Wave 191, combined with the rigorous weighting procedures, provides a strong foundation for the reliability of the reported findings.


