

The Spring 2026 Global Attitudes Survey, conducted by Pew Research Center, employed a multifaceted methodology combining telephone, face-to-face, and online interviews, executed by reputable research firms including Gallup, Langer Research Associates, and the Social Research Centre. The findings presented in this survey are derived from national samples, with specific exceptions noted where applicable. A comprehensive overview of the international survey methodology and detailed country-specific sample designs can be accessed through Pew Research Center’s official channels.
This significant survey delves into a wide array of public opinions and attitudes across numerous countries, providing a crucial barometer of global sentiment on critical issues. The methodology underpinning these insights is designed to ensure both breadth and depth in understanding diverse perspectives. Pew Research Center’s commitment to rigorous research practices is evident in its detailed approach to data collection and analysis.
Understanding the Survey’s Demographic and Categorical Framework
To facilitate a nuanced understanding of the survey’s findings, Pew Research Center employs specific demographic variables and categorizations, often drawing upon external data sources. These classifications are meticulously detailed to ensure transparency and allow for robust analysis.

Ideological Spectrum Analysis
A key aspect of the survey’s analytical framework involves understanding respondents’ self-placement on an ideological scale. By posing questions about political ideology using varied scales, researchers categorize individuals into distinct ideological groups: the left, center, and right. This granular approach to ideological positioning allows for the identification of distinct attitudinal patterns within each segment of the political spectrum, providing a deeper comprehension of the drivers behind public opinion.
Religious Identification as a Key Variable
In each surveyed nation, participants were queried about their current religious affiliation. The analysis then focuses on religious groups with sufficiently large sample sizes to ensure statistical reliability. While specific religious groups are analyzed independently, respondents identifying with other religious backgrounds are consistently included in the overall national totals, even if their specific group could not be analyzed separately due to sample size constraints. This ensures that all voices are accounted for in the broader demographic picture.
Standardizing Educational Attainment
To enable meaningful comparisons of educational backgrounds across different countries, Pew Research Center standardizes educational levels according to the United Nations’ International Standard Classification of Education (ISCED). This standardized approach ensures that differences in national education systems do not skew comparative analyses, providing a more accurate picture of educational disparities and their potential impact on public opinion.
High- and Middle-Income Country Classifications
Countries participating in the survey are classified as either high-income or middle-income based on established categories from the World Bank. These classifications are primarily determined by per capita gross national income. This categorization has been consistently applied in previous Pew Research Center analyses, including studies on global views of China, satisfaction with democratic governance, perceptions of globalization, and definitions of national identity. This consistent application allows for longitudinal analysis and the identification of trends over time within these economic strata.
The American Trends Panel: A Deep Dive into U.S. Public Opinion
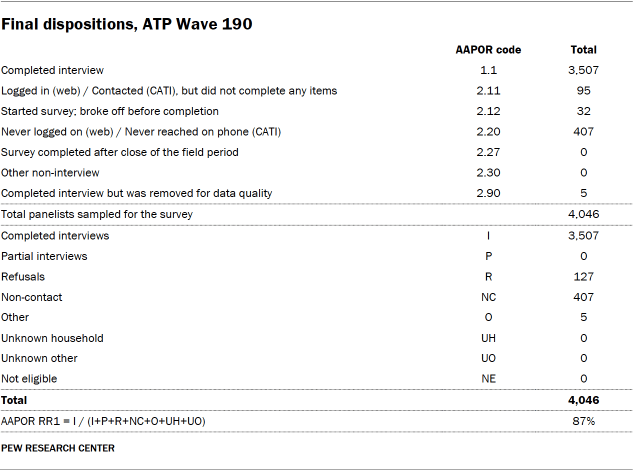
Complementing its global research, Pew Research Center operates the American Trends Panel (ATP), a nationally representative panel of U.S. adults. The data for this report originates from Wave 190 of the ATP, conducted between March 23 and March 29, 2026. This specific wave saw a robust response rate, with 3,507 out of 4,046 sampled panelists participating, achieving a survey-level response rate of 87%.
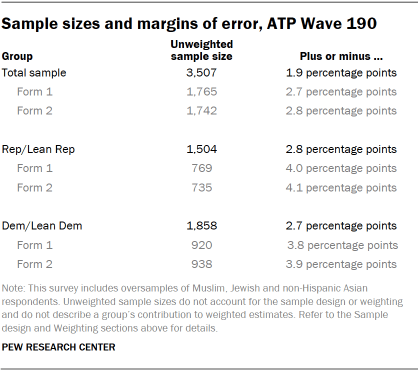
The cumulative response rate, which accounts for nonresponse during the initial recruitment surveys and subsequent panel attrition, stands at 3%. The break-off rate among panelists who began the survey but did not complete it was a minimal 1%. For the full sample of 3,507 respondents, the margin of sampling error at a 95% confidence level is plus or minus 1.9 percentage points, indicating a high degree of precision in the survey’s findings.
To enhance the accuracy of estimates for smaller demographic subgroups, the survey incorporated an oversample of Muslim, Jewish, and non-Hispanic Asian adults. These oversampled groups are statistically weighted back to their accurate proportions within the overall U.S. population, ensuring that their inclusion does not distort the national figures while still allowing for detailed analysis of their specific views.
The survey was administered by SSRS on behalf of Pew Research Center, utilizing both online (n=3,377) and live telephone (n=130) interviewing methods. Interviews were conducted in both English and Spanish to ensure accessibility and inclusivity. Further details about the ATP’s structure and ongoing operations can be found in the "About the American Trends Panel" section on the Pew Research Center website.
Panel Recruitment and Evolution
Since 2018, the ATP has adopted an address-based sampling (ABS) methodology for panel recruitment. This process involves mailing study cover letters and pre-incentives to a stratified, random sample of households selected from the U.S. Postal Service’s Computerized Delivery Sequence File, which is estimated to cover 90% to 98% of the U.S. population. Within each selected household, the adult with the next birthday is invited to participate. Prior to 2018, the ATP was recruited through random-digit-dial surveys conducted via landline and cellphone, administered in English and Spanish.
The ATP has consistently recruited a national sample of U.S. adults approximately once per year since 2014. In certain years, supplementary recruitment efforts, known as oversamples, have been implemented to improve data accuracy for underrepresented groups. For instance, Hispanic adults were oversampled in 2019, Black adults in 2022, and Asian adults in 2023. This ongoing adaptation of recruitment strategies reflects a commitment to maintaining a representative and inclusive panel.
Sample Design and Stratification
The target population for this specific survey comprised noninstitutionalized individuals aged 18 and older residing in the United States. The sample design featured a stratified random selection from the ATP, with Muslim, Jewish, and non-Hispanic Asian adults being selected with certainty. The remaining panelists were sampled at rates designed to maintain proportionality with their respective shares of the U.S. adult population. Respondent weights are meticulously adjusted to reflect differential probabilities of selection, as detailed in the weighting section.
Questionnaire Development and Rigorous Testing
The survey instrument was meticulously developed by Pew Research Center in close collaboration with SSRS. The online survey platform underwent rigorous testing by both the SSRS project team and Pew Research Center researchers on various PC and mobile devices. The SSRS team also conducted extensive testing with simulated data in SPSS to verify the logic and randomizations within the questionnaire prior to its official launch, ensuring a seamless and accurate survey experience for respondents.
Incentives for Participation
All respondents were offered a post-paid incentive for their participation, with options to receive it as a check or a gift code for major online retailers like Amazon.com, Target.com, or Walmart.com. The incentive amounts, ranging from $5 to $20, were varied based on the demographic group’s traditional propensity for survey participation, with higher incentives offered to harder-to-reach populations. This differential incentive strategy aims to boost participation rates among groups that historically exhibit lower survey response propensities.
Data Collection Protocol
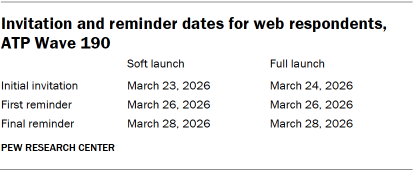
The field period for this survey spanned from March 23 to March 29, 2026. Data collection occurred through self-administered web surveys and live telephone interviews. For online participants, postcard notifications were dispatched on March 23. Survey invitations were issued in two phases: a soft launch involving 60 panelists, commencing on March 23, and a full launch on March 24, extending to all remaining English- and Spanish-speaking sampled online panelists.
Panelists participating online received an email invitation, followed by up to two email reminders for non-respondents. Those who had consented to SMS notifications received an SMS invitation with a direct survey link and up to two SMS reminders.
For telephone surveys, prenotification postcards were mailed on March 20. A soft launch commenced on March 23, continuing until three interviews were completed. Subsequently, numbers for all remaining English- and Spanish-speaking sampled phone panelists were dialed throughout the field period. Telephone interviewers from SSRS made up to six calls to ensure maximum participation.
Ensuring Data Quality Through Rigorous Checks
Pew Research Center researchers implemented stringent data quality checks to identify and mitigate potential satisficing behavior among respondents. This included scrutinizing patterns of excessive unanswered questions or consistent selection of the first or last response option. As a result of these checks, five ATP respondents were excluded from the final survey dataset prior to weighting and analysis, ensuring the integrity of the collected data.
The Weighting Process: Accounting for Complexity
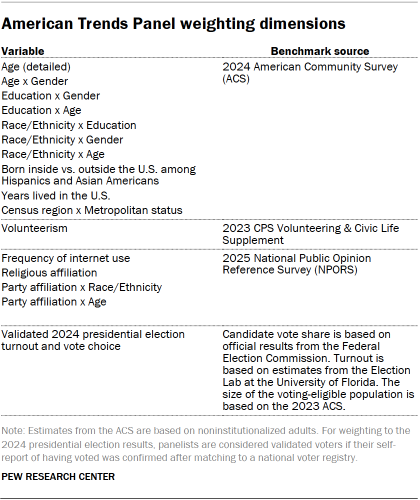
The ATP data undergoes a comprehensive weighting process designed to account for the multiple stages of sampling and nonresponse inherent in panel survey methodologies. Initially, each panelist receives a base weight reflecting their probability of recruitment into the panel. These weights are subsequently calibrated against population benchmarks to correct for nonresponse during recruitment and panel attrition. If a subsample of panelists is invited for a specific wave, this weight is adjusted to reflect differential selection probabilities.
Among panelists who completed the survey, the weight is further calibrated to align with population benchmarks outlined in the accompanying table. To mitigate the impact of extreme weight values on precision, weights are trimmed at the 1st and 99th percentiles. Sampling errors and statistical significance tests are conducted with full consideration of the effects of this weighting process.
The provided tables detail the unweighted sample sizes and the expected margin of sampling error at a 95% confidence level for various demographic groups within the survey. Additional information on sample sizes and sampling errors for other subgroups is available upon request. It is important to note that beyond sampling error, potential biases can arise from question wording and practical challenges encountered during survey administration.
Dispositions and Response Rates: A Measure of Engagement
The detailed breakdown of final dispositions and cumulative response rates for ATP Wave 190 provides critical insights into the panel’s engagement and the overall success of the data collection efforts. These metrics underscore the commitment to transparent reporting and the rigorous standards maintained by Pew Research Center in its survey operations. The meticulous documentation of these aspects ensures that researchers and the public can fully understand the basis of the reported findings and the reliability of the data.