This comprehensive report details the rigorous methodology employed by the Pew Research Center for Wave 188 of the American Trends Panel (ATP), a nationally representative survey of U.S. adults. Conducted between March 2nd and March 15th, 2026, this wave specifically focused on panelists who identified as working either full-time or part-time for pay and who are parents or guardians of at least one child under the age of 18. The survey achieved a robust survey-level response rate of 84%, with 2,242 panelists responding out of a sampled 2,843. This total includes 1,900 respondents from the primary ATP cohort and an additional 342 participants from the SSRS Opinion Panel, underscoring a collaborative effort to ensure data breadth and depth.
The cumulative response rate, accounting for the complexities of recruitment and panel attrition over time, stands at 3%. The break-off rate, measuring instances where panelists began the survey but did not complete it, was minimal at just 1%. For the entirety of the 2,242 respondents, the margin of sampling error is calculated to be plus or minus 2.6 percentage points at the 95% confidence level. This indicates a high degree of precision in the reported findings.
To ensure the representation and accurate estimation of opinions and experiences among smaller demographic subgroups, the survey design incorporated oversamples of Asian non-Hispanic working parents, Hispanic working mothers, and Black non-Hispanic working mothers. These targeted oversamples are crucial for providing statistically reliable insights into the diverse experiences of these communities. Following data collection, these oversampled groups are meticulously weighted back to reflect their accurate proportions within the broader U.S. population, thereby maintaining the overall representativeness of the findings. The survey was administered by SSRS on behalf of Pew Research Center, utilizing a mixed-mode approach that included online interviews with 2,220 participants and live telephone interviews with 22 individuals. All interviews were conducted in both English and Spanish to accommodate a wider range of respondents. For those seeking further details on the ATP’s operational framework, extensive documentation is available on the Pew Research Center’s website.

Panel Recruitment and Evolution
The foundation of the American Trends Panel’s reliability is its sophisticated recruitment process. Since 2018, the ATP has primarily utilized address-based sampling (ABS) for recruiting new panelists. This method involves mailing study materials, including a cover letter and a pre-incentive, to a stratified, random sample of households selected from the U.S. Postal Service’s Computerized Delivery Sequence File, a comprehensive database estimated to cover 90% to 98% of the U.S. population. Within each sampled household, the adult whose birthday is next is invited to participate, ensuring a random selection of individuals within a household. While the specifics of the ABS recruitment protocol have undergone refinements since its inception, these details are available upon request. Prior to 2018, the ATP relied on landline and cellphone random-digit-dial surveys for recruitment, administered in both English and Spanish.
The ATP has been consistently recruiting a national sample of U.S. adults on an approximate annual basis since 2014. To enhance the accuracy of data for underrepresented groups, some years have included additional recruitment efforts, known as "oversamples." For instance, Hispanic adults were oversampled in 2019, Black adults in 2022, and Asian adults in 2023. These strategic oversampling initiatives are critical for capturing the nuanced perspectives of diverse populations that might otherwise be diluted in a purely random sample.
Sample Design and Execution
The target population for Wave 188 of the ATP survey comprised noninstitutionalized individuals aged 18 and older residing in the United States who are employed either full-time or part-time and are parents or guardians to at least one child under the age of 18. All active ATP members who met these eligibility criteria were invited to participate in this specific wave.
To bolster representation among key demographic segments, the ATP was supplemented with oversamples drawn from SSRS’s Opinion Panel (OP). These oversampled groups specifically included Asian non-Hispanic working parents, Hispanic working mothers, and Black non-Hispanic working mothers. The eligibility of panelists from both the ATP and the SSRS OP was determined through a series of screening questions administered during ATP Wave 186 (conducted January 27th to February 10th, 2026) and through existing panel profile data for SSRS OP panelists. Crucially, these screening questions were re-administered to all respondents at the commencement of Wave 188 to ensure continued eligibility and the integrity of the sample. Any respondent who did not reconfirm their eligibility was excluded from the final dataset.
Questionnaire Development and Testing
The questionnaire for Wave 188 was meticulously developed by Pew Research Center in close consultation with SSRS. A rigorous testing process was implemented to ensure the integrity and functionality of the survey instrument. The web-based program used for online respondents underwent thorough testing on both personal computer and mobile device platforms by the SSRS project team and Pew Research Center researchers. To further validate the survey’s logic and randomization protocols, the SSRS project team populated test data that was subsequently analyzed using SPSS, confirming that all programmed elements functioned as intended before the survey’s public launch. This comprehensive testing phase is a critical step in minimizing potential errors and ensuring the accuracy of the data collected.
Incentives and Data Collection Protocol
To encourage participation and acknowledge the time and effort of respondents, all participants were offered a post-paid incentive. Both ATP and OP respondents had the flexibility to choose their incentive preference, opting for either a physical check or a digital gift code redeemable at Amazon.com, Target.com, or Walmart.com. The incentive amounts varied from $5 to $20 for ATP respondents and $5 to $10 for OP respondents. These differential incentive amounts were strategically designed to increase survey participation rates among groups that traditionally exhibit lower response propensities, reflecting the Pew Research Center’s commitment to inclusive data collection.
The data collection field period for this survey spanned from March 2nd to March 15th, 2026. Data was gathered through a dual approach: self-administered web surveys and live telephone interviews.
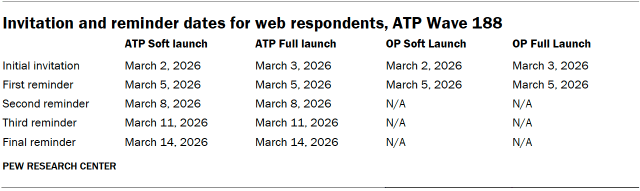
For panelists completing surveys online, postcard notifications were dispatched to a subset of ATP panelists on March 2nd. Survey invitations were disseminated through a two-stage launch process: a soft launch and a full launch. The soft launch, initiated on March 2nd, included 130 panelists (60 from ATP, 70 from OP) to identify and resolve any unforeseen technical issues. Following this, all remaining English- and Spanish-speaking sampled online panelists received their initial invitation on March 3rd as part of the full launch. Panelists engaging with the survey online were sent an email invitation and received up to four email reminders if they had not yet completed the survey. For ATP panelists who had consented to receive SMS messages, an SMS invitation containing a direct link to the survey was sent, followed by up to four SMS reminders.
For panelists participating via telephone with a live interviewer, prenotification postcards were mailed to ATP panelists on February 27th. A soft launch for telephone interviews commenced on March 2nd, with dialing continuing until a total of nine completed interviews were secured. Subsequently, the phone numbers of all remaining English- and Spanish-speaking sampled phone panelists were dialed throughout the remainder of the field period. Panelists who opted for telephone surveys could receive up to six calls from trained SSRS interviewers to maximize completion rates.
Data Quality Assurance
Pew Research Center researchers implemented stringent data quality checks to ensure the integrity and reliability of the collected data. These checks were designed to identify any respondents exhibiting patterns of "satisficing," a behavior where respondents may not engage fully with the survey, leading to less thoughtful answers. Specifically, researchers examined response patterns for excessively high rates of unanswered questions or consistent selection of the first or last answer option presented. Through this meticulous review process, no respondents were excluded from the survey dataset prior to the weighting and analysis stages, indicating a high level of respondent engagement and data quality.
Weighting and Statistical Precision
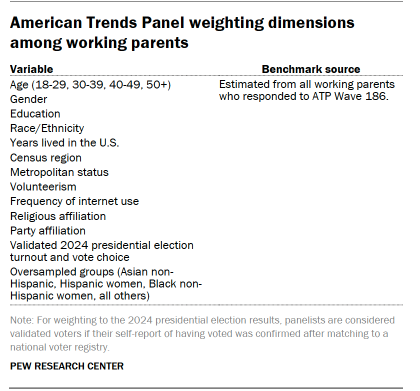
The survey data underwent a sophisticated weighting process designed to account for multiple stages of sampling and nonresponse that occur throughout the panel survey lifecycle. Each panelist was assigned an initial base weight reflecting their probability of recruitment into the panel. For SSRS Opinion Panelists, these base weights were provided by SSRS. The base weights for the combined sample from both ATP and SSRS were then integrated and calibrated to align with established population benchmarks, as detailed in the accompanying table. These population benchmarks are weighted estimates derived from all working parents who responded to ATP Wave 186.
To mitigate any potential loss of precision that could arise from extreme variations in weights, the weights were trimmed at the 1st and 99th percentiles. This trimming procedure helps to ensure that the weighting process does not disproportionately influence the results. Sampling errors and tests of statistical significance are calculated taking into account the impact of this weighting procedure, providing a more accurate representation of the data’s variability.
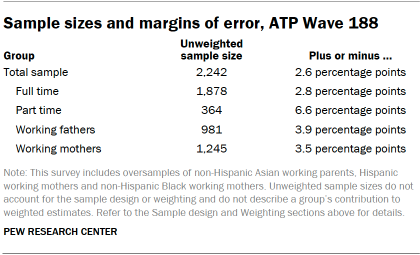
The accompanying table illustrates the unweighted sample sizes and the expected margin of error at the 95% confidence level for various subgroups within the survey. These figures are essential for understanding the statistical precision of estimates for different segments of the surveyed population. For sample sizes and sampling errors pertaining to other specific subgroups, such data is available upon request. Beyond sampling error, it is important to acknowledge that factors such as question wording and practical challenges inherent in survey administration can also introduce error or bias into the findings of opinion polls.
Income Tier Calculation
The calculation of family income tiers in this study is a nuanced process that adjusts for household size and regional cost-of-living differences. Panelists are assigned to income tiers based on the median adjusted family income of all American Trends Panel members. This adjustment process involves several key steps:
- Income Adjustment: Each respondent’s reported family income is first adjusted for household size, reflecting that larger households typically require more income to maintain the same standard of living as smaller ones.
- Geographic Cost-of-Living Adjustment: Following the adjustment for household size, incomes are further adjusted to account for regional variations in the cost of living. This ensures that income figures are comparable across different geographic areas with varying price levels. For example, an income of $40,200 in the Pine Bluff, Arkansas metropolitan area, a region with a cost of living 19.7% below the national average, is considered financially equivalent to an income of $59,100 in the San Francisco-Oakland-Berkeley metropolitan area, which has a cost of living 18.2% above the national average, assuming similar household sizes.
- Tier Assignment: After these adjustments, respondents are assigned to income tiers. These tiers are benchmarked against the median adjusted family income of the entire ATP panel at the time of the most recent annual profile survey. This comparative approach ensures that the income tiers reflect the relative economic standing of respondents within the panel’s overall income distribution.
Respondents from the SSRS Opinion Panel oversample undergo the same family income and household size questions. Their incomes are adjusted using the same methodology detailed above. Subsequently, they are assigned an income tier based on the median adjusted family income calculated for the full ATP at the time of the most recent annual profile survey. This standardized approach ensures consistency and comparability of income tier assignments across all participants.
A Note on the Asian Adult Sample
It is important to note a specific characteristic of the Asian adult sample in this study. The survey includes a total of 284 Asian adults. However, the sample primarily comprises English-speaking Asian adults. Consequently, this subset may not be entirely representative of the broader Asian adult population in the United States, which includes individuals with varying levels of English proficiency and diverse linguistic backgrounds. Despite this limitation, the Pew Research Center considers it essential to report the views and experiences of Asian adults on the topics covered in this study. As a standard practice, the responses from Asian adults are incorporated into the general population figures presented throughout this report, contributing to a more complete understanding of the overall survey findings.