
An in-depth analysis by the Pew Research Center reveals significant demographic shifts and characteristics within the Native Hawaiian and Pacific Islander (NHPI) population residing in the United States, highlighting their unique experiences and growing presence. As of 2024, approximately 1.7 million individuals identify as Native Hawaiian or Pacific Islander, tracing their heritage to Hawaii, Guam, Samoa, or other islands across Oceania. This vibrant community represents 0.5% of the total U.S. population, encompassing a rich tapestry of cultures, histories, and distinct communities. The findings underscore the importance of understanding this demographic group beyond broader "Asian American and Pacific Islander" categorizations, offering a clearer picture of their specific realities.
The Pew Research Center’s comprehensive study, primarily utilizing data from the U.S. Census Bureau’s 2024 American Community Survey (ACS) and supplemented by earlier decennial census data, aims to illuminate the demographic, social, and economic landscape of NHPIs living in the 50 U.S. states and the District of Columbia. This research is particularly timely as May marks Asian/Pacific American Heritage Month, a period dedicated to celebrating the contributions and acknowledging the presence of Asian Americans, Native Hawaiians, and Pacific Islanders in the United States.
Population Growth and Shifting Identity
The NHPI population in the United States has experienced substantial growth over the past two decades. Between 2000 and 2024, the number of NHPIs living in the 50 states and D.C. nearly doubled, increasing by 94% from approximately 875,000 to 1.7 million. This growth significantly outpaced the overall U.S. population, which saw a 21% increase during the same period.

A key driver of this rapid expansion is the increasing number of individuals identifying as NHPI in combination with at least one other race. The multiracial NHPI population grew by an impressive 119% since 2000, while the single-race NHPI population saw a 64% increase. This trend reflects a broader societal shift toward greater acceptance and reporting of multiracial identities, as observed in other demographic analyses. In 2024, a notable 61% of Native Hawaiians and Pacific Islanders identified with two or more races, a figure substantially higher than the 13% recorded for the U.S. population overall. This phenomenon is particularly pronounced among Native Hawaiians, with 74% identifying as multiracial compared to 53% of Pacific Islanders.
Diverse Origins and Geographic Distribution
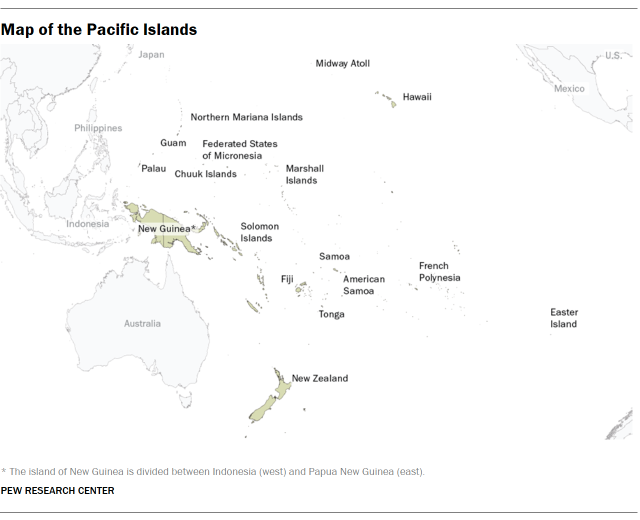
The Native Hawaiian and Pacific Islander demographic is not monolithic, encompassing individuals with origins from distinct regions of Oceania. The U.S. Census Bureau categorizes NHPI origins into three primary regions: Polynesia, Micronesia, and Melanesia. People of Polynesian descent constitute the largest segment of the NHPI population in the U.S.
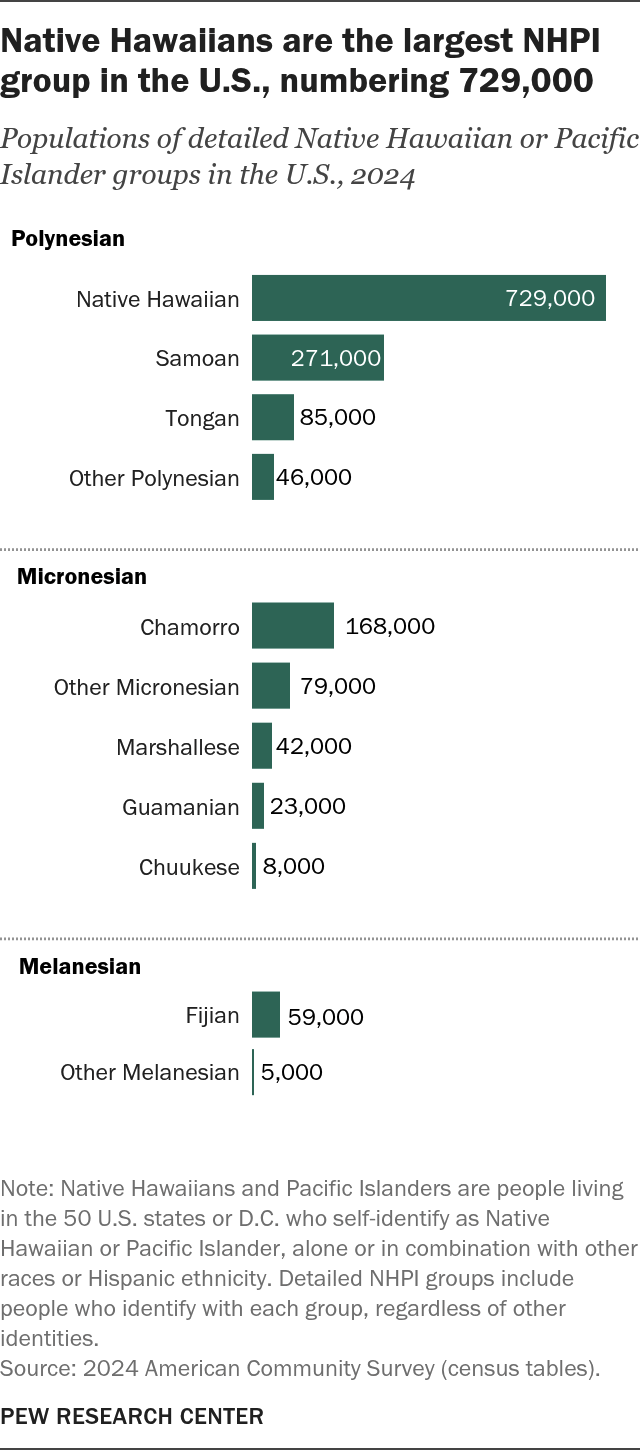
Detailed analysis reveals specific origin groups:
- Polynesian: This group is led by Native Hawaiians, who represent the largest single origin group within the broader NHPI category in the U.S. In 2024, there were approximately 729,000 Native Hawaiians living in the United States, accounting for 43% of the total NHPI population. Samoans are the second-largest Polynesian group, numbering around 271,000, followed by Tongans.
- Micronesian: This category includes Chamorros, who trace their ancestry to the Mariana Islands (including Guam and the Northern Mariana Islands). Chamorros numbered approximately 168,000 in 2024, making them the third-largest NHPI origin group overall. Other significant Micronesian groups include Marshallese and Chuukese.
- Melanesian: Fijians represent the largest group within this category, with smaller numbers from other Melanesian islands.
In addition to these specified groups, around 270,000 individuals identified as NHPI without specifying a particular origin.
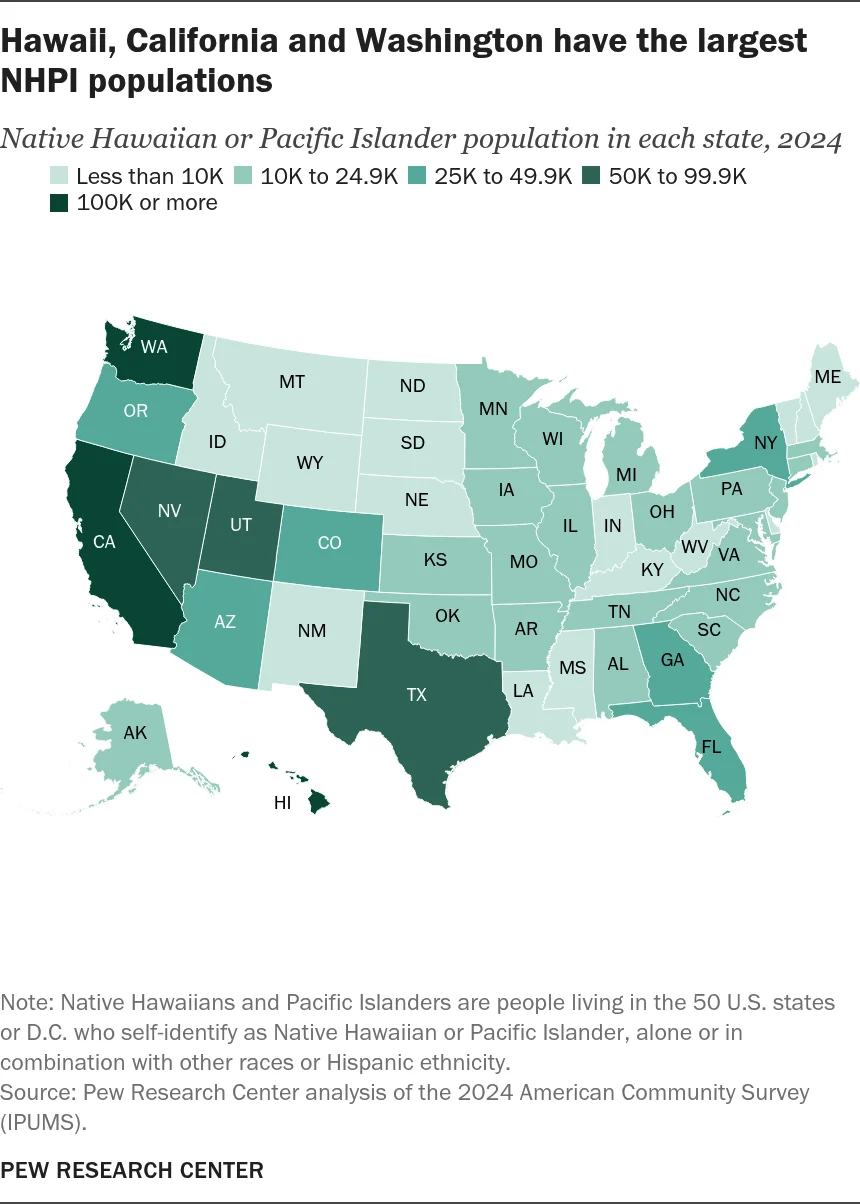
Geographically, the NHPI population is concentrated in several key areas. While Hawaii remains a significant hub, with 398,148 NHPI residents in 2024, a larger proportion of the NHPI population now resides in the continental United States. California leads with the largest NHPI population outside of Hawaii, numbering 341,579, followed by Washington with 106,650, and Texas with 82,753. Other states with substantial NHPI communities include Nevada, Utah, and Oregon.
Historical Context and Political Ties
The presence of Native Hawaiians and Pacific Islanders in the United States is deeply rooted in historical political and cultural connections. The U.S. established control over several Pacific Islands at the turn of the 20th century. Guam, for instance, was ceded to the U.S. after the Spanish-American War, while Hawaii transitioned from an independent kingdom to a U.S. territory and, ultimately, a state in 1959.
Three Pacific Islands currently function as U.S. territories with permanent populations: American Samoa, Guam, and the Northern Mariana Islands. Residents of these territories hold varying statuses; individuals born in American Samoa are U.S. nationals, granting them the right to live and work in the U.S. but without federal voting rights. Residents of these territories have limited representation in Congress, with non-voting delegates to the U.S. House of Representatives.
Furthermore, the U.S. maintains compacts of free association with three independent Pacific Island nations: the Federated States of Micronesia, the Marshall Islands, and Palau. These agreements facilitate U.S. defense strategy in the region and provide economic assistance, while granting citizens of these nations the right to live and work in the U.S. as nonimmigrants. These historical and ongoing relationships shape migration patterns and community formation within the United States.
Demographic Profile: Age, Education, and Income
Native Hawaiians and Pacific Islanders are, on average, a younger demographic compared to the overall U.S. population. In 2024, the median age for NHPIs was 30.3 years, significantly lower than the median age for all Americans, which stood at 39.2 years. This youthfulness is reflected in the proportion of the population under 18, which is 31% for NHPIs compared to 21% for the general U.S. population. Multiracial NHPIs tend to be younger than their single-race counterparts, with a median age of 28.0 years versus 33.0 years.

Educational attainment among NHPIs shows a positive trend, though it still lags behind the national average. In 2024, 27% of NHPI adults aged 25 and older held a bachelor’s degree or higher, an increase from 17% in 2000. Despite this progress, the gap between NHPIs and the overall U.S. adult population, where 37% have a college degree, has slightly widened. Multiracial NHPIs demonstrate higher educational attainment (32%) than single-race NHPIs (20%), with both groups showing improvement over time.
Economically, the median annual household income for NHPI households was $93,600 in 2024, closely mirroring the national median of $95,300. However, within Hawaii, NHPI households reported a median income of $100,000, which was lower than the median income for all households in the state ($112,200). This indicates regional economic disparities within the NHPI community.
Social and Political Landscape
Intermarriage rates among Native Hawaiians and Pacific Islanders are notably high. In 2024, 59% of NHPI adults who were married lived with a spouse of a different racial or ethnic background. This rate is comparable to that of American Indian and Alaska Native adults and significantly higher than that of most other racial and ethnic groups in the U.S.

Politically, NHPI adults are relatively evenly divided in their party affiliations, according to a Pew Research Center survey conducted in 2023-2024. Approximately 47.2% identified as Republican or leaned Republican, while 40.1% identified as Democratic or leaned Democratic, with about 12.7% expressing no political leaning. These figures are not significantly different from the overall U.S. adult population’s political identification, though the NHPI sample size was smaller, leading to wider error margins in the estimates. The number of NHPIs eligible to vote in the U.S. has also grown substantially, from 473,000 in 2000 to approximately 1.1 million in 2024.
Conclusion and Future Outlook
The Pew Research Center’s analysis provides a vital snapshot of the Native Hawaiian and Pacific Islander population in the United States, highlighting their dynamic growth, rich diversity, and evolving identities. As this community continues to expand and diversify, ongoing research and targeted initiatives will be crucial to understanding and addressing their unique needs and contributions. The data underscores the importance of recognizing NHPIs as a distinct demographic group with specific cultural, social, and economic realities that warrant dedicated attention and policy consideration. The increasing multiracial identification and geographic dispersion suggest a complex future for community building and representation within the broader American narrative.


