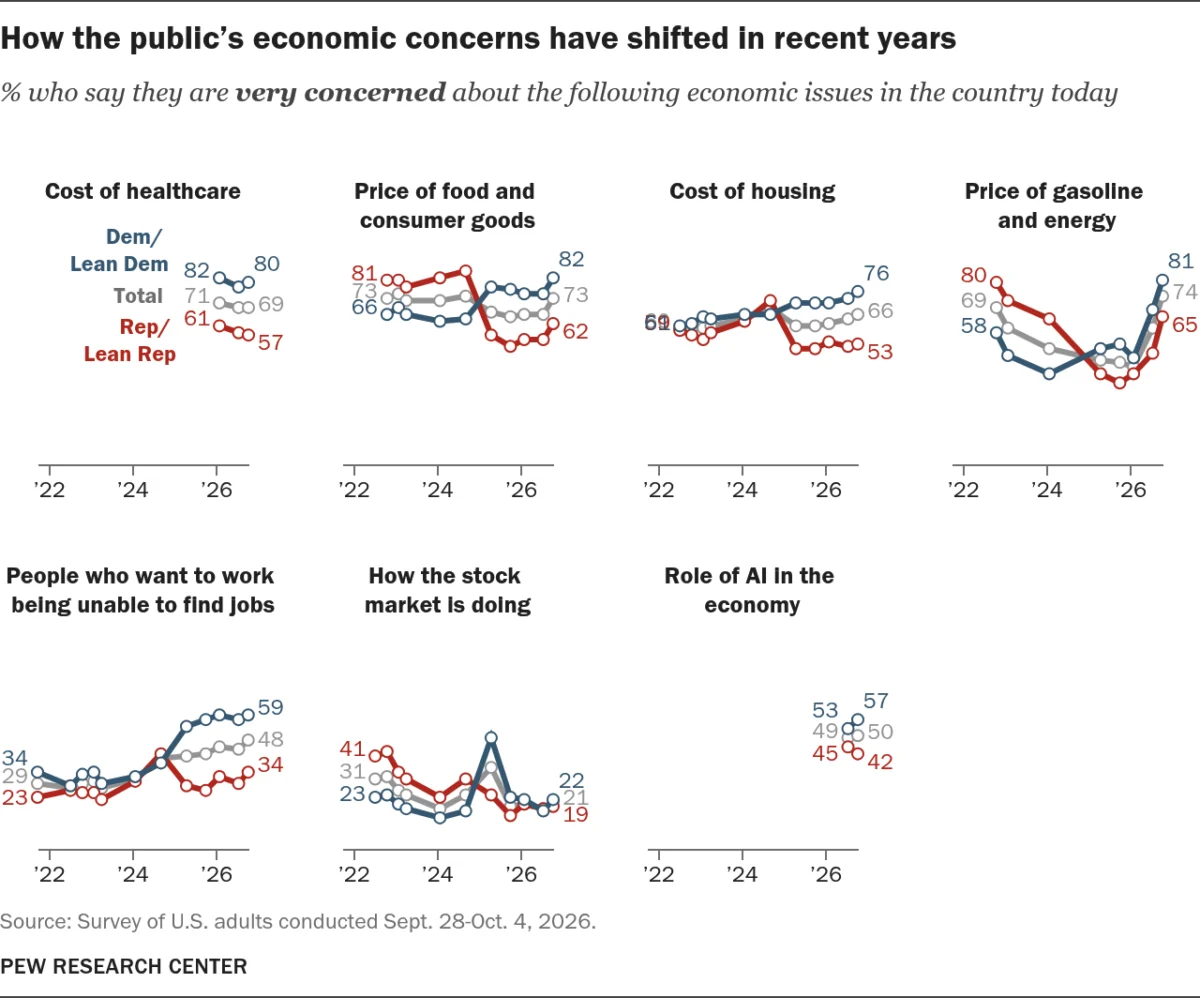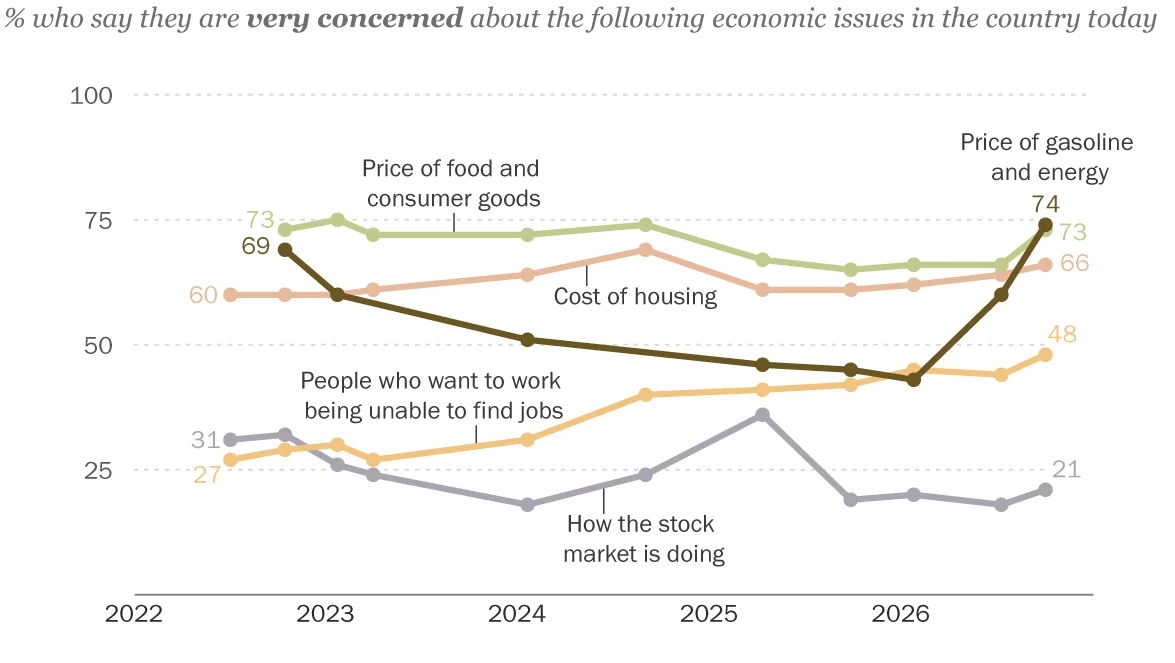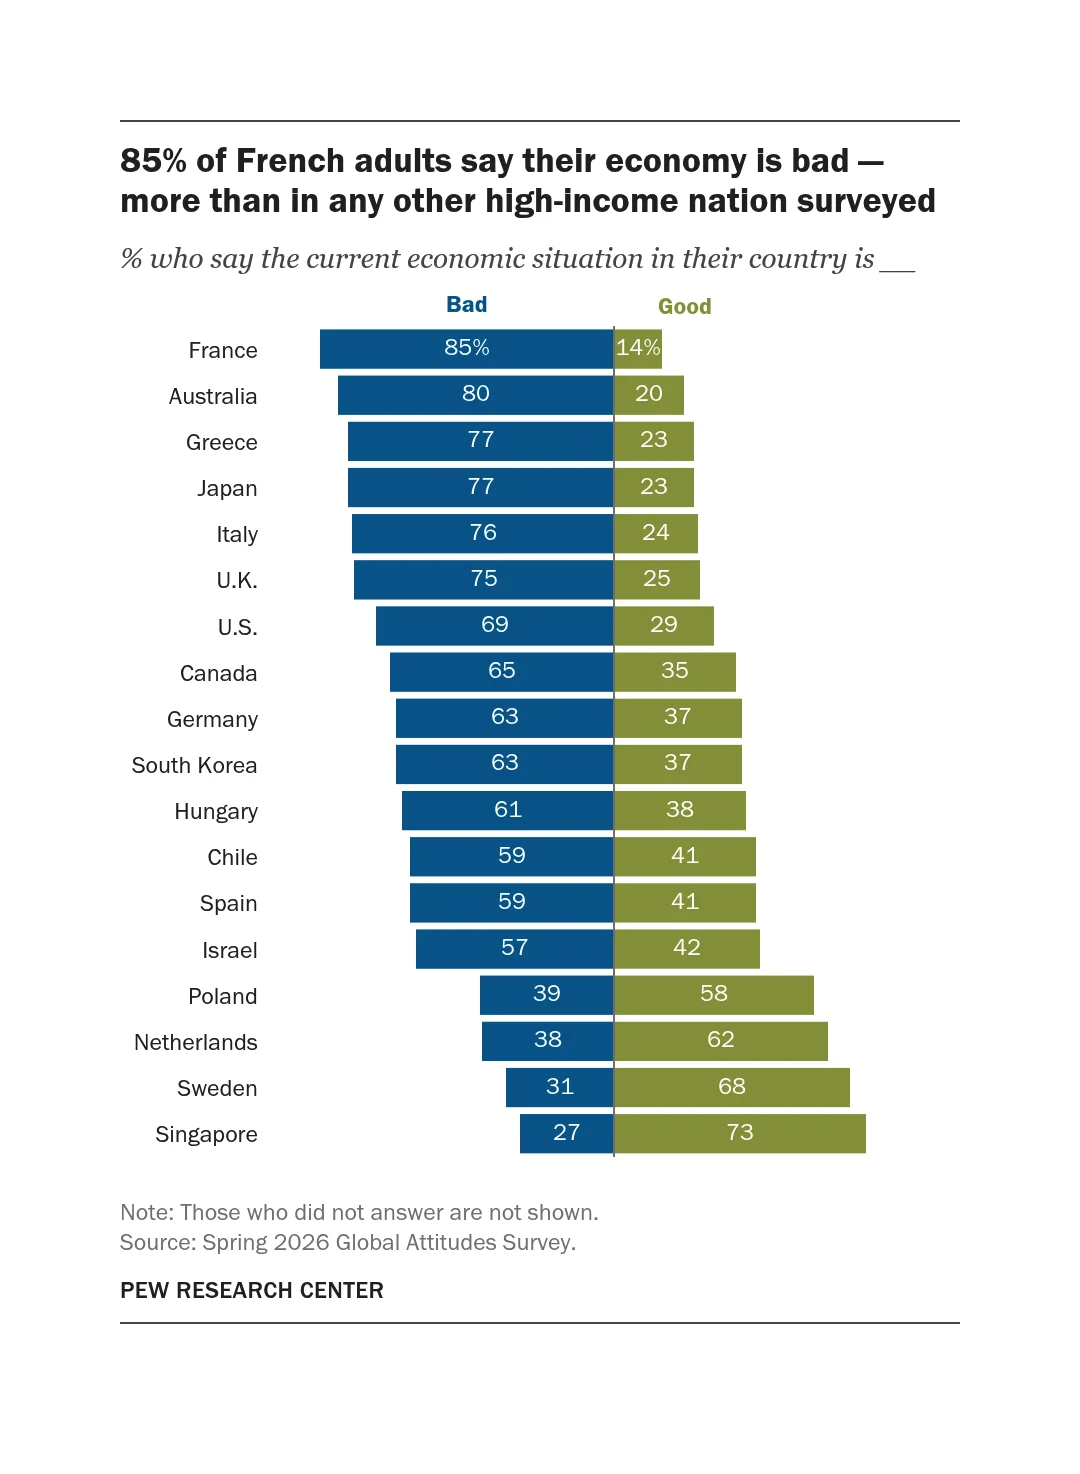
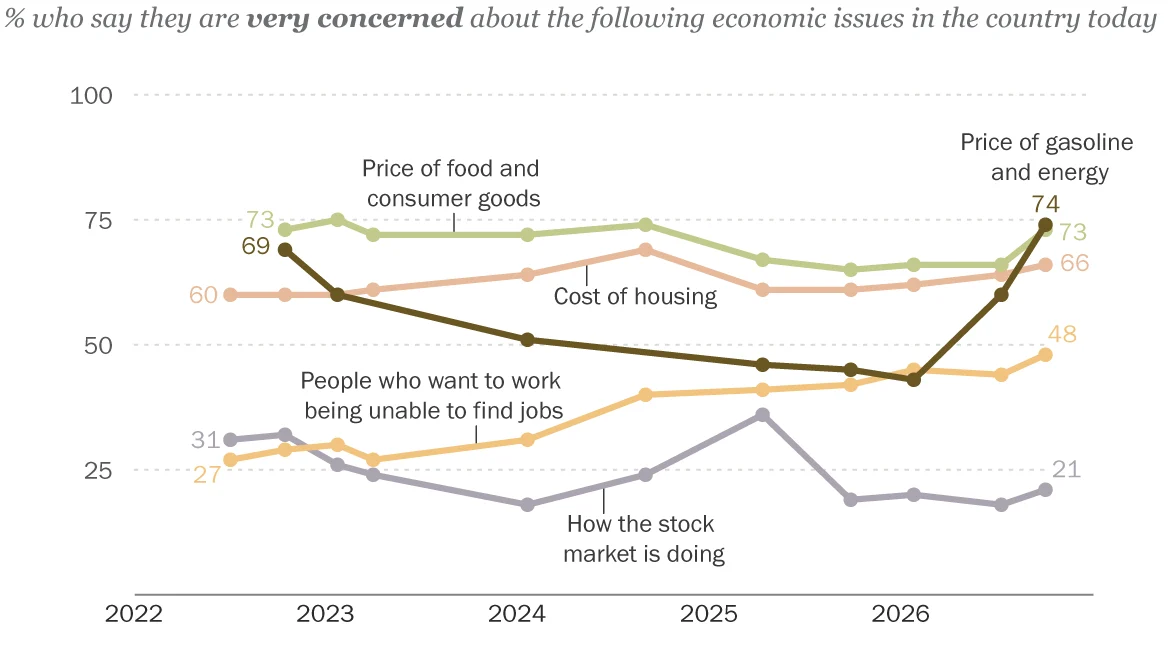
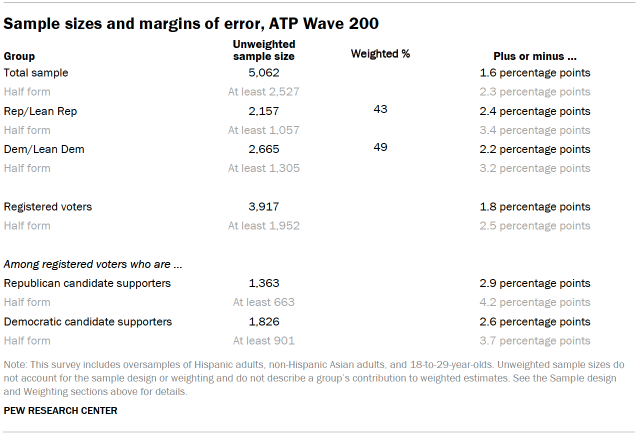
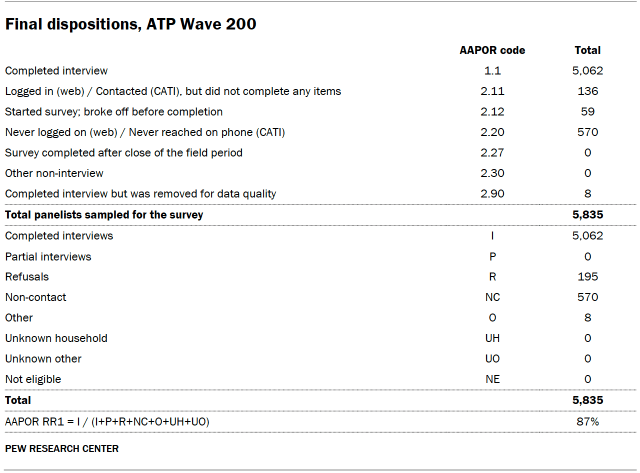
The data gathered in this specific wave, conducted from September 28 to October 4, 2026, represents a critical snapshot of the American electorate. With a robust response rate of 87% among sampled panelists, the study provides a high degree of confidence in its findings, bolstered by a margin of sampling error for the full sample of just plus or minus 1.6 percentage points. Such precision is essential for researchers, policymakers, and the public, as the data serves as a foundation for understanding shifting trends in economic sentiment and social behavior.
Evolution of Survey Recruitment and Methodology
The methodology behind the American Trends Panel has evolved significantly since its inception in 2014. Initially, the panel was built using traditional random-digit-dial (RDD) methods, utilizing both landlines and cellphones to reach respondents. However, as communication habits shifted and response rates for traditional telephone polling declined, the Center transitioned in 2018 to an address-based sampling (ABS) approach.

This shift to ABS, which involves sending physical mailings—including cover letters and pre-incentives—to households randomly selected from the U.S. Postal Service’s Computerized Delivery Sequence File, has allowed for more consistent engagement. This file is estimated to cover between 90% and 98% of the U.S. population, offering a more comprehensive reach than older methods. Within each selected household, the "next-birthday" method is employed to ensure random selection of an individual respondent, mitigating the risk of self-selection bias.
The panel is refreshed periodically, with new national samples recruited approximately once per year. These recruitment waves often incorporate targeted efforts to oversample underrepresented demographic groups—such as Black, Hispanic, and Asian adults—to ensure that the final dataset is sufficiently robust for granular analysis. This commitment to inclusivity is not merely a matter of representation; it is a technical necessity for producing reliable estimates that accurately reflect the experiences of smaller demographic subgroups.
Data Collection Protocols and Quality Assurance
The execution of Wave 200 involved a multi-channel approach coordinated by SSRS, a firm specializing in survey research. The primary mode of data collection was online (4,874 respondents), supplemented by live telephone interviewing (188 respondents). By offering the survey in both English and Spanish, the researchers further ensured that the panel remained reflective of the broader linguistic diversity in the United States.
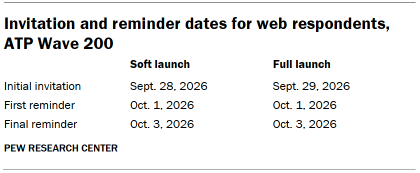
Quality control begins long before the first respondent logs in. Before the full launch, the survey instrument underwent rigorous testing on both PC and mobile platforms. The project teams at Pew and SSRS simulated datasets to stress-test the logic and randomization of the survey, ensuring that the questionnaire flow remained consistent regardless of the device used.
During the field period, the research team implemented stringent data quality checks. These measures are designed to identify "satisficing"—a behavior where respondents provide superficial or patterned answers to complete the survey quickly. In this wave, eight respondents were flagged for patterns such as leaving high volumes of questions blank or selecting the same answer option for every item in a series. These individuals were excluded from the final analysis to protect the integrity of the data.
The Role of Incentives and Human-AI Collaboration
A significant driver of the high participation rates observed in Wave 200 is the strategic use of post-paid incentives. Participation in the ATP is not an unpaid labor of civic duty; respondents are offered compensation ranging from $5 to $20, depending on the anticipated difficulty of reaching their demographic group. By offering a choice between a check or gift codes for major retailers like Amazon, Target, or Walmart, the researchers provide flexibility that appeals to a wide range of respondents. This tiered incentive structure is specifically designed to boost engagement among groups that have traditionally shown lower response propensities.
Modernizing the analytical process, the research team utilized AI-assisted text classification to process open-ended responses. This technology allows for the rapid categorization of qualitative data, which can then be scrutinized and validated by human researchers. This hybrid approach ensures that the nuance of human language is preserved while benefiting from the speed and efficiency of machine learning.
Analytical Weighting and Statistical Significance
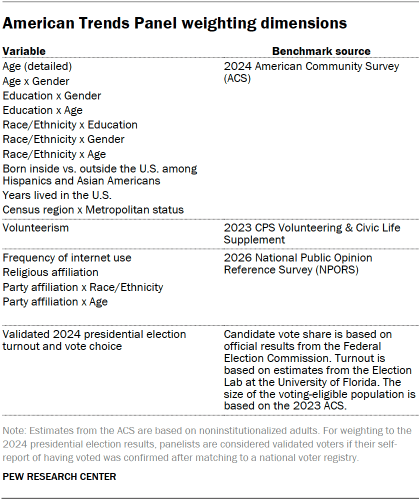
Raw survey data is rarely a perfect mirror of the population. To correct for the inherent biases of nonresponse and the specific oversampling of certain demographics, the Center employs a sophisticated weighting process. This process begins with a base weight, which is then calibrated to match population benchmarks derived from census data.
The weighting process adjusts for:
- Differential probabilities of selection based on recruitment protocols.
- Nonresponse patterns that occur between recruitment and active participation.
- Panel attrition, which is the inevitable loss of participants over time.
By trimming the weights at the 1st and 99th percentiles, the researchers minimize the impact of extreme values that could otherwise skew the results. This statistical rigor ensures that the final figures reported in the study are representative of the U.S. adult population, despite the complex underlying sampling design.
Broader Implications and Public Trust
The reliance on a stable, long-term panel like the ATP carries significant implications for the field of public opinion research. By tracking the same individuals over years, the Center can observe shifts in attitudes and behaviors that would be invisible in a series of independent cross-sectional polls. This longitudinal perspective allows for a deeper understanding of causality and trend development.
However, the methodology also underscores the persistent challenges in modern polling. The cumulative response rate—which accounts for every stage of recruitment, attrition, and the specific survey wave—sits at 3%. While this is common in the current survey landscape, it highlights the increasing difficulty of engaging the public in a time of declining trust in institutions.
The transparency demonstrated by providing detailed methodology reports, such as the one for Wave 200, is a vital step in maintaining public trust. By documenting everything from the "next-birthday" selection method to the specifics of AI-coding and weighting dimensions, the Center provides the scientific community with the necessary tools to evaluate the credibility of the data.
Conclusion
As the U.S. navigates complex economic and social landscapes, the data derived from the American Trends Panel serves as an essential, fact-based compass. The methodology behind Wave 200 reflects a meticulous balance of traditional survey science and modern technological efficiency. By prioritizing demographic representation, rigorous quality control, and transparent statistical adjustment, the American Trends Panel continues to set a standard for national survey research. For those analyzing the findings of this survey, understanding the behind-the-scenes effort of the methodology is just as important as the data points themselves, as it provides the context required to interpret the complex story of contemporary American life.