

Pew Research Center’s latest comprehensive survey, Wave 181 of the American Trends Panel (ATP), conducted between October 6 and October 16, 2025, provides a robust snapshot of American public opinion. This extensive data collection effort involved 8,046 panelists, representing a 64% survey-level response rate (AAPOR RR3). The panel’s methodology, meticulously detailed, underscores a commitment to national representativeness and the accurate representation of diverse demographic groups. This methodology is critical for understanding the nuances of public sentiment on a wide array of issues facing the nation.
Overview of the Survey and Its Reach
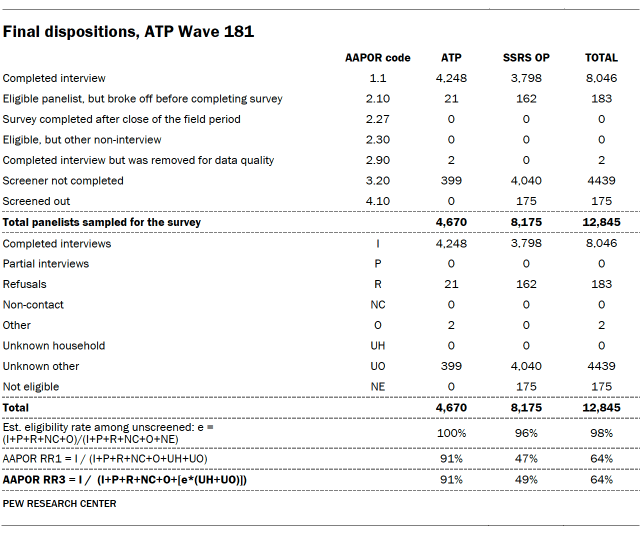
The foundation of this report is data derived from Wave 181 of the ATP, a distinguished nationally representative panel comprised of randomly selected U.S. adults. The survey’s execution period, from October 6 to October 16, 2025, captured a recent cross-section of American perspectives. A total of 8,046 panelists actively participated in the survey, out of 12,845 who were initially sampled. This resulted in a strong survey-level response rate of 64%, calculated according to the American Association for Public Opinion Research (AAPOR) standard, specifically RR3. Crucially, the total respondent pool was augmented by an additional 3,798 participants from the SSRS Opinion Panel, enhancing the breadth and depth of the data.
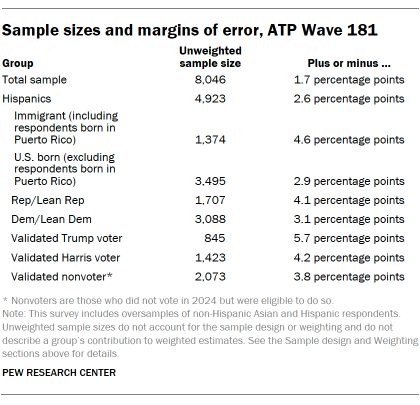
The cumulative response rate, which accounts for nonresponse during the recruitment phase and any attrition over time, stands at 2%. This figure, while seemingly low, is a standard metric for longitudinal panels that have been in existence for a considerable period, reflecting the inherent challenges in maintaining a consistently engaged panel over many years. The break-off rate, indicating the percentage of panelists who logged in but did not complete at least one item, was a minimal 2%. For the entirety of the 8,046 respondents, the margin of sampling error at a 95% confidence level is plus or minus 1.7 percentage points. This margin of error signifies the degree of precision expected in survey results, meaning that if the survey were repeated under identical conditions, the results would fall within this range 95% of the time.
A key feature of the ATP’s design, implemented to ensure more precise estimates for smaller demographic subgroups, is the strategic use of oversampling. In this particular wave, non-Hispanic Asian and Hispanic adults were oversampled on the ATP. This technique is vital for capturing the opinions and experiences of populations that might otherwise be underrepresented in a purely random sample, thereby allowing for more reliable analysis of these crucial segments of the American populace. These oversampled groups are subsequently weighted back to their accurate proportions within the overall U.S. adult population during the analysis phase, ensuring that the final results reflect the demographic composition of the country.

The survey was administered by SSRS on behalf of Pew Research Center, utilizing a mixed-mode approach. The majority of interviews, 7,784, were conducted online, while 262 participants were interviewed via live telephone. This dual-mode strategy aims to accommodate varying preferences and access to technology among respondents, further bolstering the representativeness of the sample. Interviews were conducted in both English and Spanish to ensure accessibility for a wider range of participants. For those interested in the broader operational framework of the ATP, Pew Research Center offers detailed information on their website under the section "About the American Trends Panel."
Panel Recruitment: A Foundation of Representativeness
The robustness of the ATP’s findings is deeply rooted in its sophisticated panel recruitment strategy. Since 2018, the panel has exclusively employed address-based sampling (ABS) for recruiting new members. This method begins with mailing a study cover letter and a pre-incentive to a stratified, random sample of households selected from the U.S. Postal Service’s Computerized Delivery Sequence File. This file is known to cover a substantial portion of the U.S. population, estimated between 90% and 98%. Within each selected household, the adult who has the next birthday is invited to participate. While the specifics of the ABS recruitment protocol have seen refinements over time, detailed information is available upon request, underscoring the transparency of the Center’s research practices. Prior to 2018, the ATP relied on landline and cellphone random-digit-dial surveys for recruitment, administered in both English and Spanish.
The recruitment of a national sample of U.S. adults to the ATP has been a recurring annual event since 2014. In select years, the recruitment process has incorporated additional efforts, termed "oversamples," to specifically enhance the accuracy of data for groups that are traditionally underrepresented in national surveys. For instance, Hispanic adults were oversampled in 2019, Black adults in 2022, and Asian adults in 2023, demonstrating a proactive approach to ensuring demographic diversity within the panel.
Sample Design: Ensuring Proportional Representation
The overarching target population for this particular survey encompassed noninstitutionalized individuals aged 18 and older residing in the United States. The sample design featured a stratified random sample drawn from the ATP. In this stratification, non-Hispanic Asian and Hispanic adults were specifically selected with certainty, meaning they were guaranteed inclusion to achieve sufficient sample sizes. The remaining panelists were then sampled at rates meticulously calibrated to ensure that the proportion of respondents within each stratum closely mirrored their respective share of the U.S. adult population. This intricate process aims to minimize sampling bias and maximize the representativeness of the sample.
To further bolster the representation of Hispanic voices, the ATP was supplemented with a sample from the SSRS Opinion Panel (OP). This supplementary group comprised panelists who had previously identified as Hispanic. Upon commencing the survey, these Opinion Panel respondents underwent a series of screening questions to confirm their eligibility. Individuals who indicated they identified as Hispanic were deemed eligible to participate, thereby enriching the data on this demographic.
Questionnaire Development and Testing: A Commitment to Precision
The development of the survey questionnaire was a collaborative effort between Pew Research Center researchers and SSRS. This consultative process ensures that the questions are phrased in a clear, unbiased, and effective manner, designed to elicit accurate and meaningful responses. The web program utilized for online respondents underwent rigorous testing across both personal computer and mobile device platforms, conducted by the SSRS project team and Pew Research Center researchers. This thorough testing phase is crucial for identifying and rectifying any technical glitches or user experience issues that could potentially impact data collection. Furthermore, the SSRS project team populated test data that was meticulously analyzed using SPSS to verify the logic and randomizations within the survey instrument before its official launch. This comprehensive pre-launch validation process is a hallmark of high-quality survey research.
Incentives: Encouraging Participation
To encourage participation and acknowledge the valuable time and effort of its panelists, all respondents were offered a post-paid incentive. Participants had the flexibility to choose their incentive in the form of a check or a digital gift code redeemable at major online retailers such as Amazon.com, Target.com, or Walmart.com. The incentive amounts varied, ranging from $5 to $20 for ATP respondents and $5 to $10 for OP respondents. This differential incentive structure was strategically designed to account for varying levels of difficulty in reaching different segments of the population. Specifically, higher incentives were offered to individuals belonging to groups that traditionally exhibit lower survey response propensities, a measure aimed at increasing panel survey participation among these harder-to-reach demographics.
Data Collection Protocol: A Multi-Faceted Approach
The data collection for this survey spanned from October 6 to October 16, 2025, employing a dual-mode approach: self-administered online surveys and live telephone interviews.
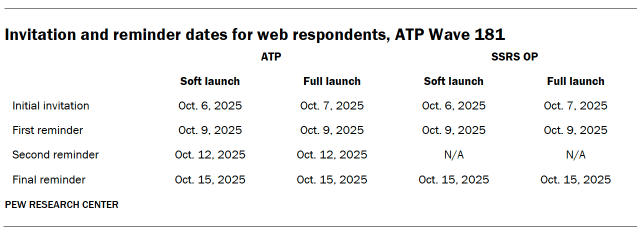
For online participants, the process began with postcard notifications mailed to a subset of panelists on October 6. Survey invitations were strategically rolled out in two distinct phases: a soft launch and a full launch. The soft launch, which commenced on October 6, included 801 panelists (60 from the ATP and 741 from the OP). This initial phase allowed for fine-tuning the survey experience before broader distribution. Subsequently, all remaining English- and Spanish-speaking sampled online panelists were included in the full launch, receiving their invitations on October 7. Panelists participating online were sent an email invitation and, if they did not respond, up to three email reminders. For ATP panelists who had consented to SMS notifications, an SMS invitation with a direct link to the survey was sent, accompanied by up to three SMS reminders for non-respondents.
For participants completing the survey via telephone with a live interviewer, prenotification postcards were mailed to ATP panelists on October 3. A soft launch for telephone interviews took place on October 6, with dialing continuing until a total of seven interviews were successfully completed (four from the ATP and three from the OP). Following the soft launch, numbers for all remaining English- and Spanish-speaking sampled phone panelists were dialed throughout the remainder of the field period. Panelists opting for telephone surveys could receive up to six calls from trained SSRS interviewers, ensuring ample opportunity for engagement.
Data Quality Checks: Upholding Integrity
Maintaining the highest standards of data quality is paramount for Pew Research Center. To this end, Center researchers implemented rigorous data quality checks designed to identify any respondents exhibiting patterns of satisficing. Satisficing, in survey research, refers to respondents providing answers that are "good enough" rather than exerting full cognitive effort to provide accurate responses. These checks included scrutinizing whether respondents left an unusually high number of questions blank or consistently selected the first or last answer option presented in a series. As a direct result of these meticulous checks, two ATP respondents were removed from the survey dataset prior to the weighting and analysis phases, ensuring the integrity of the final findings.
Weighting: Adjusting for Representativeness
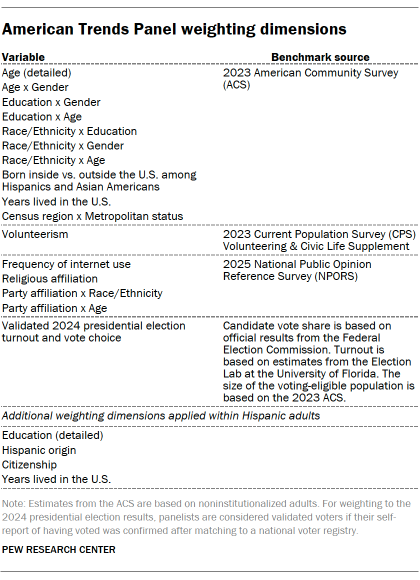
The weighting process for the ATP data is a sophisticated, multi-stage procedure designed to account for the various sampling stages and nonresponse that can occur throughout the panel survey lifecycle. Each panelist initially possesses a base weight that reflects their probability of being recruited into the panel. For respondents from the SSRS Opinion Panel, these base weights were provided by SSRS. The base weights for both ATP and OP respondents were then combined and scaled to accurately reflect the sample design.
Following this combination, the integrated weights were further calibrated to align with the population benchmarks detailed in an accompanying table. To mitigate any potential loss in precision that might arise from extreme variations in the weights, these were trimmed at the 1st and 99.5th percentiles. This trimming process ensures that outliers do not disproportionately influence the results. Crucially, the sampling errors and tests of statistical significance used in the analysis fully incorporate the effect of this weighting procedure, providing a more accurate representation of the population.
The accompanying tables provide a breakdown of the unweighted sample sizes and the expected sampling error at a 95% confidence level for various subgroups within the survey. These tables are essential for researchers to understand the precision of estimates for different demographic segments. While sampling error is a critical component of survey accuracy, it is important to acknowledge that other factors, such as question wording and practical challenges inherent in conducting surveys, can also introduce error or bias into the findings of opinion polls.
Dispositions and Response Rates: A Measure of Engagement
Detailed tables outlining the final dispositions of the sampled individuals and the various response rates achieved for ATP Wave 181 are provided. These tables offer a transparent view of the survey’s engagement metrics, including the number of completed interviews, refusals, and other outcomes. The cumulative response rate, a key indicator of overall panel health and survey success, is also presented, providing context for the representativeness of the collected data.
Family Income Tiers: A Nuanced Calculation
The calculation of family income tiers, as reported in this study, is a sophisticated process designed to offer a more meaningful and comparable measure of economic well-being. Income data is adjusted for two key factors: household size and geographic cost-of-living differences. This adjustment acknowledges that the financial needs and purchasing power of a household vary significantly based on the number of individuals it supports and the economic environment in which it is situated.
Following these adjustments, panelists are assigned to income tiers. These tiers are established based on the median adjusted family income of all members within the American Trends Panel. The process involves several meticulous steps:
- Calculating Adjusted Family Income: Each respondent’s reported family income is adjusted for household size. For example, a family of four is generally considered to have different needs than a family of two with the same reported income.
- Applying Cost-of-Living Adjustments: The adjusted family income is then further modified to account for regional variations in the cost of living. This is achieved by comparing the price levels in a respondent’s geographic area to the national average. For instance, an area with a higher cost of living will see its residents’ adjusted incomes effectively increased, while those in lower-cost areas will see their adjusted incomes effectively decreased, ensuring that income levels are comparable across different regions.
- Establishing Income Tiers: The median adjusted family income for the entire ATP panel serves as the benchmark. This median is then used to create distinct income tiers (e.g., lowest, lower-middle, upper-middle, highest). Panelists are assigned to these tiers based on where their adjusted family income falls relative to this median.
Two illustrative examples highlight the impact of these cost-of-living adjustments. In the Pine Bluff metropolitan area of Arkansas, an area characterized by a relatively low cost of living (19.7% below the national average), a family with an income of $40,200 would be considered financially equivalent to a family of the same size earning $59,100 in the San Francisco-Oakland-Berkeley metropolitan area of California, one of the nation’s most expensive regions (18.2% above the national average). This meticulous adjustment ensures that income comparisons are not skewed by geographical economic disparities.
Respondents from the SSRS Opinion Panel oversample also underwent the same family income and household size adjustments. Their incomes were similarly adjusted using the detailed procedures outlined above. Subsequently, they were assigned an income tier based on the median adjusted family income calculated for the full ATP panel during the most recent annual profile survey. This consistent methodology ensures that income comparisons across all participants are equitable and reflect their true economic standing in relation to the broader panel population. The detailed methodology behind these calculations ensures that the data presented is not only statistically sound but also conceptually robust, providing a more accurate and nuanced understanding of the economic landscape of American households.