
Pew Research Center’s latest findings, released from Wave 190 of the American Trends Panel (ATP), offer a detailed look into the methodology underpinning their nationally representative surveys. Conducted between March 23 and March 29, 2026, this wave engaged 3,507 U.S. adults out of 4,046 who were sampled, achieving a robust survey-level response rate of 87%. The comprehensive approach employed by the ATP aims to provide reliable data on the opinions and experiences of a diverse American populace, with particular attention paid to ensuring the accuracy of estimates for smaller demographic subgroups.
Ensuring Rigorous Data Collection: The ATP’s Core Principles
At the heart of the ATP’s methodology is a commitment to rigorous sampling, questionnaire design, and data collection protocols. The panel, which comprises randomly selected U.S. adults, undergoes continuous recruitment and management to maintain its representativeness. For Wave 190, the survey-level response rate of 87% signifies a strong engagement from sampled panelists. However, the cumulative response rate, which accounts for initial recruitment surveys and ongoing panel attrition, stands at 3%. This figure, while seemingly low, is typical for longitudinal panels and reflects the challenges of maintaining participation over extended periods. The break-off rate, measuring the percentage of panelists who started the survey but did not complete at least one item, was a minimal 1%, indicating a high level of engagement once panelists began the survey.
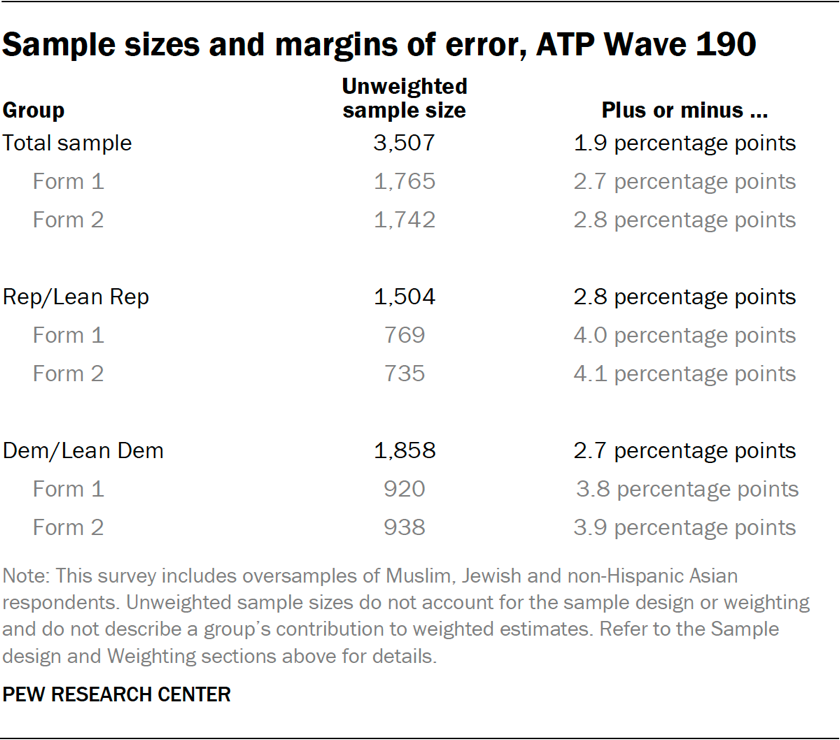
A critical element of the ATP’s design is its commitment to providing precise estimates for smaller demographic groups. In Wave 190, specific oversamples were implemented for Muslim, Jewish, and non-Hispanic Asian adults. This strategic oversampling ensures that these communities, which constitute smaller proportions of the overall U.S. population, are adequately represented in the sample, allowing for more reliable analysis of their unique perspectives. These oversampled groups are subsequently weighted back to their accurate population proportions during the data analysis phase, preventing any undue influence on the overall national estimates.

The survey itself was administered through a mixed-mode approach, with SSRS conducting the fieldwork for Pew Research Center. A significant majority of respondents, 3,377, participated via online interviews, while 130 individuals were surveyed through live telephone interviews. This dual approach aims to capture a broader spectrum of the population, accommodating those who may have varying levels of internet access or preferences for traditional communication methods. Interviews were conducted in both English and Spanish to further enhance inclusivity and ensure that language barriers do not impede participation.
A Deep Dive into Panel Recruitment and Sample Design
The foundation of the American Trends Panel’s reliability lies in its sophisticated panel recruitment and sample design strategies. Since 2018, the ATP has employed address-based sampling (ABS) as its primary recruitment method. This method involves mailing a cover letter and a pre-incentive to a stratified, random sample of households selected from the U.S. Postal Service’s Computerized Delivery Sequence File. This file is estimated to cover a substantial 90% to 98% of the U.S. population. Within each selected household, the adult with the next birthday is designated as the potential participant. While the specifics of the ABS recruitment protocol have evolved over time, the core principle remains to establish a representative pool of U.S. adults. Prior to 2018, the ATP relied on traditional landline and cellphone random-digit-dial surveys for recruitment.
The ATP has been actively recruiting a national sample of U.S. adults annually since 2014. Recognizing the importance of demographic representation, the panel has periodically conducted special recruitment efforts, termed "oversamples," to bolster the presence of underrepresented groups. For instance, Hispanic, Black, and Asian adults were specifically oversampled in 2019, 2022, and 2023, respectively, to enhance the precision of data related to these communities.
The sample design for Wave 190 specifically targeted noninstitutionalized individuals aged 18 and older residing in the United States. The survey utilized a stratified random sample drawn from the ATP, with Muslim, Jewish, and non-Hispanic Asian adults being selected with certainty to ensure their adequate representation. The remaining panelists were sampled with probabilities designed to maintain proportionality with their respective shares of the U.S. adult population. Crucially, respondent weights are meticulously adjusted to account for any differential probabilities of selection, a process detailed further in the weighting section.
Ensuring Quality: Questionnaire Development and Data Collection Protocols
The integrity of survey data hinges on the quality of the questions asked and the methods used to collect responses. The questionnaire for Wave 190 was meticulously developed by Pew Research Center in close consultation with SSRS. Before deployment, the online survey platform underwent rigorous testing on both personal computers and mobile devices by both the SSRS project team and Pew Research Center researchers. This thorough testing ensures that the survey logic and randomizations function as intended, minimizing technical glitches and data anomalies.
To incentivize participation and acknowledge the valuable time contributed by panelists, all respondents were offered a post-paid incentive. Participants had the flexibility to choose their incentive in the form of a check or a gift code redeemable at major online retailers like Amazon.com, Target.com, or Walmart.com. The incentive amounts varied, ranging from $5 to $20, with higher amounts allocated to individuals from populations traditionally considered harder to reach. This differential incentive strategy is a deliberate effort to boost survey participation among groups that may have historically exhibited lower response propensities.
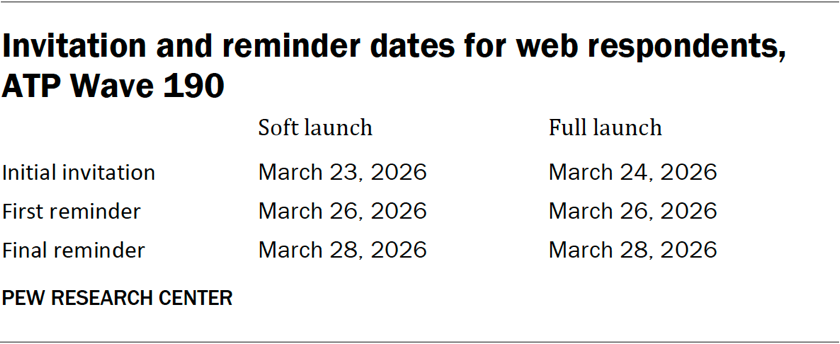
The data collection for Wave 190 spanned from March 23 to March 29, 2026. The implementation involved distinct protocols for online and telephone respondents. For online participants, postcard notifications were mailed to a subset of the panel on March 23. The survey invitations were then distributed through a two-stage launch: a soft launch involving 60 panelists began on March 23, followed by a full launch on March 24, which included all remaining English- and Spanish-speaking sampled online panelists. Panelists who opted to receive SMS notifications were sent an initial invitation via text message, along with up to two reminder messages if they had not yet responded.
For telephone-based interviews, prenotification postcards were sent out on March 20. A soft launch commenced on March 23, with interviewers making calls until a total of three interviews were completed. Subsequently, numbers for all remaining English- and Spanish-speaking sampled phone panelists were dialed throughout the remainder of the field period. To maximize response rates, panelists participating via phone could receive up to six calls from trained SSRS interviewers.
Maintaining Data Integrity: Quality Checks and Weighting
Pew Research Center places a significant emphasis on data quality. To ensure the reliability of the findings, researchers conducted thorough data quality checks to identify any respondents exhibiting patterns of satisficing, such as leaving a disproportionately high number of questions blank or consistently selecting the first or last option presented. Based on these checks, five ATP respondents were excluded from the survey dataset prior to the weighting and analysis stages.
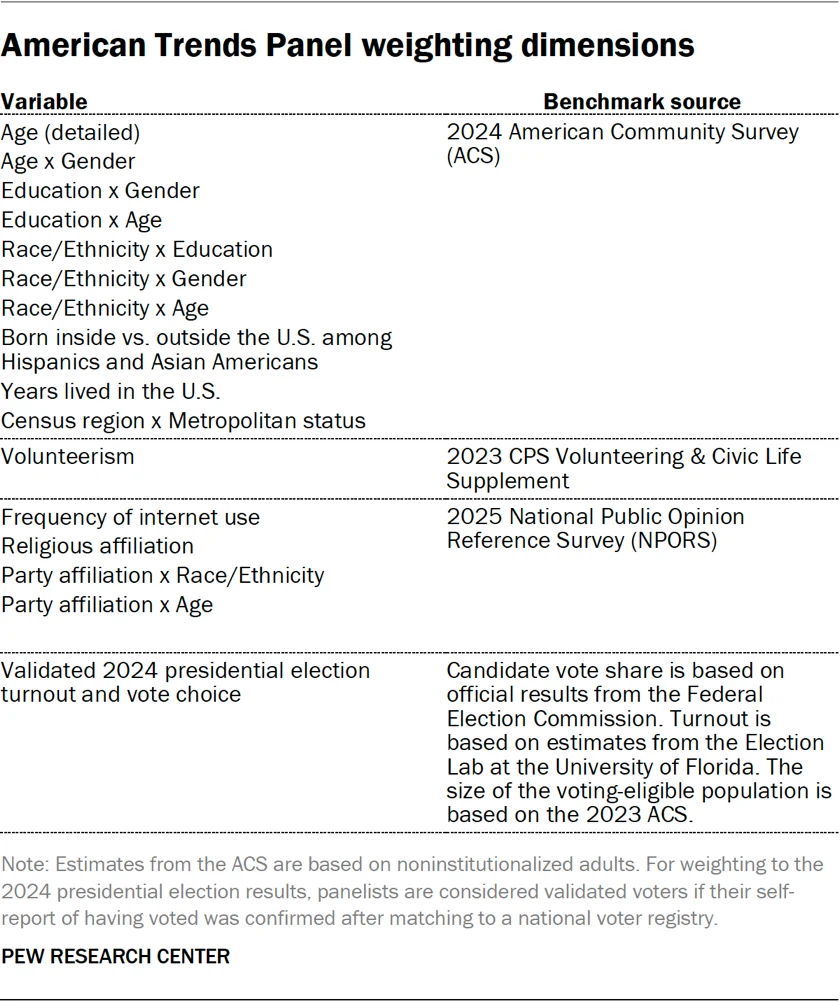
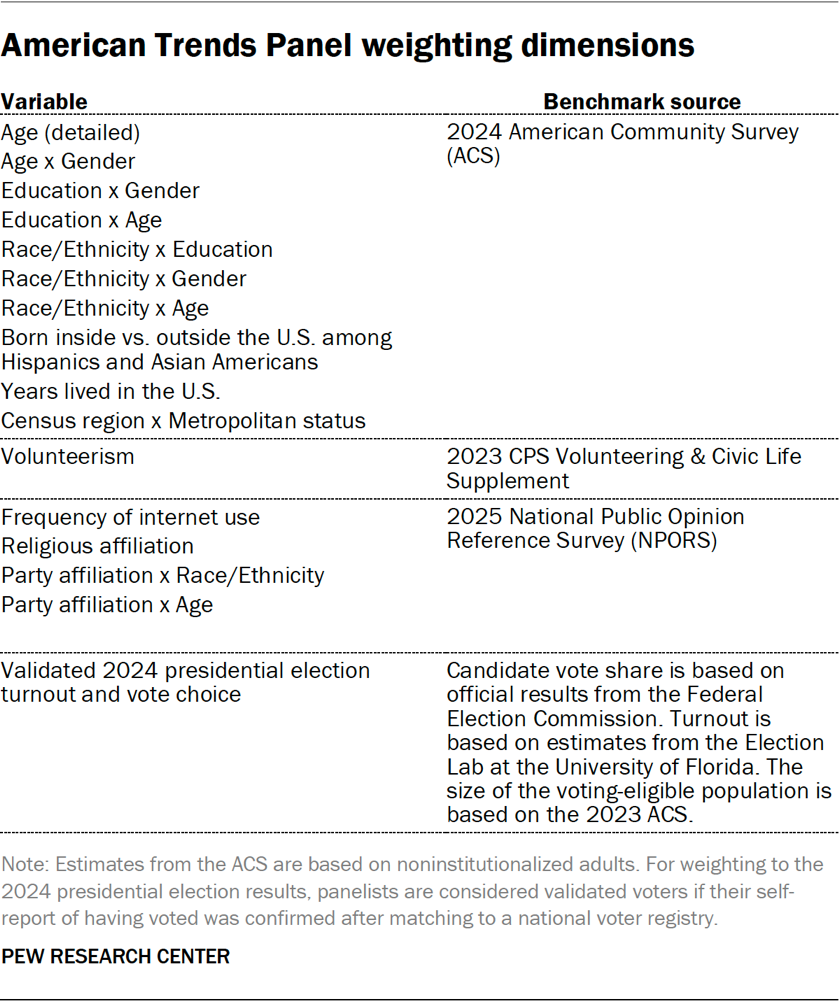
The weighting process is a critical step in ensuring that the survey data accurately reflects the U.S. adult population. The ATP data is weighted in a multi-stage process that accounts for various sampling and nonresponse events that occur throughout the panel survey lifecycle. Initially, each panelist is assigned a base weight that reflects their probability of being recruited into the panel. These base weights are then calibrated to align with established population benchmarks. This calibration addresses nonresponse to recruitment surveys and panel attrition, thereby correcting for potential biases. If only a specific subset of panelists was invited to participate in a particular wave, the weight is further adjusted to reflect these differential probabilities of selection.
Following the completion of the survey by panelists, the weights are recalibrated once more against the population benchmarks. To mitigate potential losses in precision due to extreme weight values, the weights are trimmed at the 1st and 99th percentiles. This comprehensive weighting methodology ensures that the final dataset is representative of the U.S. adult population, allowing for accurate generalizations from the sample to the broader populace. Sampling errors and tests of statistical significance are calculated with the effect of weighting taken into account, providing a more accurate measure of the data’s precision.
The analysis of Wave 190 includes tables detailing the unweighted sample sizes and the expected sampling error at a 95% confidence level for various demographic groups. These tables are crucial for understanding the precision of estimates for different segments of the population. Sample sizes and sampling errors for additional subgroups are available upon request, underscoring the Center’s commitment to transparency and in-depth data analysis. Beyond sampling error, it is important to acknowledge that question wording and practical challenges inherent in survey administration can also introduce error or bias into opinion poll findings.
Dispositions and Response Rates: A Measure of Engagement
The final disposition of sampled individuals and the resulting response rates offer a transparent view of the survey’s reach and engagement. For Wave 190, a total of 4,046 individuals were sampled, and 3,507 completed the survey. The survey-level response rate, calculated as the number of completed interviews divided by the total number of eligible individuals in the sample, stood at an impressive 87%. This high rate is indicative of a well-managed and engaging panel.
The cumulative response rate, which factors in the attrition from initial recruitment surveys and ongoing panel participation, is 3%. While this figure reflects the inherent challenges of maintaining a long-term panel, it is crucial for understanding the overall representativeness of the panel over time. The break-off rate, measuring the percentage of respondents who started the survey but did not complete it, was a minimal 1%. This low rate suggests that once panelists begin the survey, they are highly likely to complete it, pointing to a well-designed and user-friendly survey instrument.
Detailed tables present the final dispositions for ATP Wave 190, categorizing outcomes such as completed interviews, refusals, non-contact, and ineligibles. Another table provides a breakdown of the cumulative response rate for the panel, offering insight into the long-term engagement and retention of panel members. These figures are essential for researchers and the public alike to assess the methodological rigor and potential limitations of the survey findings.
The robust methodology employed by the American Trends Panel, as exemplified by Wave 190, underscores Pew Research Center’s dedication to producing high-quality, reliable data that informs public understanding of critical social and political issues in the United States. The multi-faceted approach, from recruitment and sampling to data collection and weighting, aims to ensure that the insights derived from the ATP are as accurate and representative as possible.


