
The Pew Research Center’s American Trends Panel (ATP) is a cornerstone of its comprehensive research into the attitudes, behaviors, and demographics of the United States. Wave 185 of this nationally representative panel, conducted from January 20th to January 26th, 2026, provides critical data for understanding contemporary American society. This report delves into the intricate methodology underpinning this survey, offering an in-depth look at its design, recruitment, data collection, and analytical processes to ensure the accuracy and reliability of its findings.
Overview of Wave 185: Scope and Response
Wave 185 of the American Trends Panel engaged 8,512 U.S. adults out of a sampled pool of 9,302 panelists. This resulted in a robust survey-level response rate of 92%. The cumulative response rate, which accounts for all stages of nonresponse and attrition since panelists joined the panel, stands at 3%. This metric underscores the panel’s long-term commitment to maintaining a representative sample despite the inherent challenges of panel surveys. Furthermore, the break-off rate, measuring panelists who started but did not complete the survey, was a minimal 2%, indicating a high level of engagement among participants.
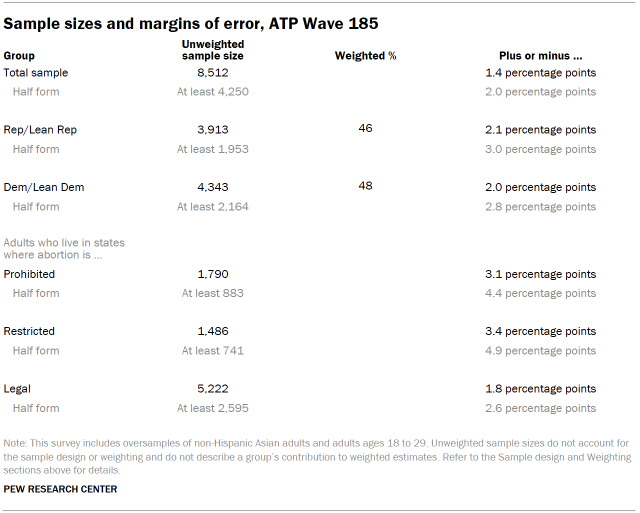
The margin of sampling error for the full sample of 8,512 respondents is plus or minus 1.4 percentage points at a 95% confidence level. This relatively small margin of error is a testament to the panel’s size and the meticulous sampling techniques employed. To enhance the precision of estimates for specific demographic groups, the survey incorporated oversamples of non-Hispanic Asian adults and adults aged 18 to 29. These groups, often smaller within the general population, require targeted recruitment and weighting to ensure their views are accurately represented. The oversampled groups are subsequently weighted back to their correct proportions in the overall U.S. adult population, a critical step in maintaining the integrity of the national estimates.

The survey was administered by SSRS, a renowned research firm, through a dual-channel approach. A significant majority (8,272 respondents) participated via online interviews, while 240 completed the survey through live telephone interviews. Both English and Spanish languages were supported to maximize accessibility and inclusivity. For those seeking more information about the ATP’s operational framework, Pew Research Center provides detailed resources, including a dedicated section on "About the American Trends Panel."
Panel Recruitment: Building a Representative Foundation
The recruitment strategy for the American Trends Panel has evolved since its inception. Since 2018, the ATP has primarily utilized Address-Based Sampling (ABS) for new panel member recruitment. This method involves mailing a cover letter, accompanied by a pre-incentive, to a stratified, random sample of U.S. households selected from the U.S. Postal Service’s Computerized Delivery Sequence File. This file is estimated to cover between 90% and 98% of the U.S. population, providing a broad reach. Within each selected household, the adult with the next birthday is identified as the potential participant. While the specifics of the ABS recruitment protocol have undergone adjustments over time, the core principle of randomly selecting households and then a specific individual within those households remains consistent. Prior to 2018, the ATP relied on traditional random-digit-dial (RDD) surveys conducted via landline and cellphone to recruit its members.
The ATP has conducted national recruitment approximately once per year since 2014. To bolster the accuracy of data for underrepresented populations, the recruitment process has sometimes included intentional oversampling efforts. For instance, Hispanic adults were oversampled in 2019, Black adults in 2022, and Asian adults in 2023, demonstrating a proactive approach to ensuring demographic diversity within the panel over time.
Sample Design: Ensuring Proportional Representation
The target population for Wave 185 comprised noninstitutionalized persons aged 18 and older residing in the United States. The sample design for this wave was a stratified random sample drawn from the existing ATP membership who had successfully completed Wave 183. This approach leverages the established relationships with existing panelists, often leading to higher cooperation rates and lower costs compared to recruiting entirely new individuals for each wave.
A key aspect of the sample design was the selection of non-Hispanic Asian adults and adults aged 18 to 29 with certainty. This means all individuals within these oversampled strata were included in the sampling frame for this wave. The remaining panelists were then sampled at rates carefully calculated to maintain proportionality with their representation in the U.S. adult population. This meticulous balancing act ensures that the survey results accurately reflect the diversity of American adults, even when specific subgroups are intentionally overrepresented in the sample for analytical purposes. The subsequent application of respondent weights, detailed later in this report, further refines the representation of these groups to match national benchmarks.
Questionnaire Development and Testing: Precision in Inquiry
The integrity of survey data begins with the questionnaire itself. For Wave 185, the questionnaire was collaboratively developed by Pew Research Center’s expert researchers in close consultation with SSRS. This collaborative process ensures that the questions are phrased clearly, are neutral, and are designed to elicit accurate and meaningful responses.
Before deployment, the web-based survey instrument underwent rigorous testing. The SSRS project team and Pew Research Center researchers meticulously tested the online program on various devices, including personal computers and mobile phones, to ensure a seamless and error-free user experience. This testing phase is crucial for identifying any technical glitches, logical inconsistencies, or display issues that could potentially affect data quality or respondent engagement. The SSRS team also populated test data that was analyzed using statistical software (SPSS) to verify the survey’s logic, skip patterns, and randomizations were functioning as intended, thereby safeguarding the data collection process from the outset.
Incentives: Encouraging Participation and Equity
To acknowledge the valuable time and effort of its panelists, the ATP provides post-paid incentives for participation. Respondents are offered a choice between receiving their incentive as a check or as a digital gift code redeemable at major online retailers like Amazon.com, Target.com, or Walmart.com. The value of these incentives ranges from $5 to $20, with differential amounts strategically employed to encourage participation from groups that may be historically harder to reach or have lower survey response propensities. This tiered incentive structure is a deliberate strategy to promote equity in participation and ensure that the panel remains representative of the diverse American population.
Data Collection Protocol: A Multi-faceted Approach
The data collection for Wave 185 spanned a defined period from January 20th to January 26th, 2026. The survey was administered through two primary channels: self-administered web surveys and live telephone interviewing.
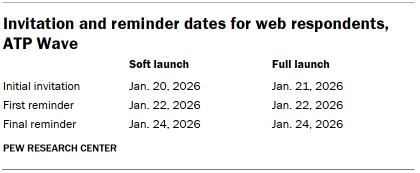
For online participants, a multi-stage invitation process was implemented. Postcard notifications were mailed to a subset of panelists on January 20th, serving as an initial heads-up. The survey invitations themselves were launched in two phases: a soft launch and a full launch. The soft launch, initiated on January 20th, included approximately sixty panelists to test the survey’s functionality in a live environment. Following this, all remaining English- and Spanish-speaking sampled online panelists received their invitations on January 21st as part of the full launch. Panelists participating online received an email invitation and were sent up to two email reminders if they did not initially respond. For those who had consented to receive SMS messages, an SMS invitation with a direct link to the survey was sent, followed by up to two SMS reminders.
The telephone interviewing process also involved a structured protocol. Prenotification postcards were mailed on January 16th to potential phone respondents. A soft launch commenced on January 20th, with interviewers dialing numbers until four completed interviews were secured. Subsequently, all remaining English- and Spanish-speaking sampled phone panelists had their numbers dialed throughout the field period. Trained SSRS interviewers made up to six calls to each selected panelist to maximize the chances of completing an interview.
Data Quality Checks: Upholding Accuracy
Pew Research Center researchers are committed to maintaining the highest standards of data quality. Prior to analysis, comprehensive data quality checks were performed on the collected responses. These checks are designed to identify any patterns of "satisficing," a phenomenon where respondents may provide less thoughtful or accurate answers to conserve mental effort. Specific indicators examined include extremely high rates of unanswered questions or consistent selection of the first or last option presented in a series of choices. Through this diligent review, two respondents exhibiting such patterns were identified and removed from the survey dataset, ensuring that the final analysis is based on the most reliable data possible.
Weighting: Adjusting for Representation
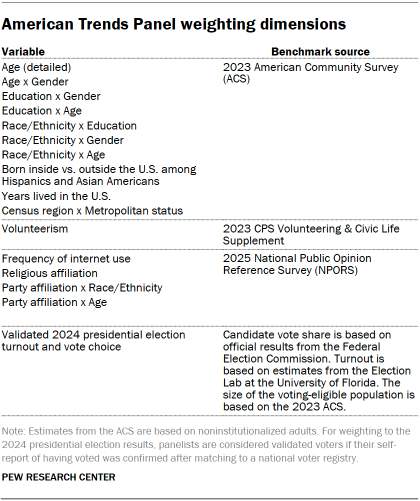
The weighting process is a critical and complex stage in the analysis of ATP data, designed to correct for various forms of sampling and nonresponse bias. Each panelist begins with a "base weight" that reflects their initial probability of being recruited into the panel. These base weights are then adjusted through a calibration process to align with established population benchmarks, as detailed in accompanying tables. This calibration addresses nonresponse to recruitment surveys and attrition (panelists who leave the panel over time).
If a subset of panelists is invited to participate in a particular wave, the weights are further adjusted to account for any differential probabilities of selection among those invited. In the case of Wave 185, where respondents were sampled from those who completed Wave 183, the weights were specifically adjusted to account for nonresponse to Wave 183.
Following initial calibration, the weights for respondents who completed the survey are recalibrated once more to match the population benchmarks presented in the accompanying table. To further enhance precision and mitigate the impact of extreme weights, the weights are trimmed at the 1st and 99th percentiles. This trimming process reduces variance in the weights, which in turn can lead to a more precise estimation of population parameters. Statistical significance tests and the calculation of sampling errors explicitly take into account the effect of this weighting procedure.
The accompanying tables provide detailed information on unweighted sample sizes and the expected sampling error at the 95% confidence level for various groups within the survey. Sample sizes and sampling errors for other demographic subgroups are available upon request, underscoring the transparency and depth of the ATP’s methodological documentation. It is important to note that beyond sampling error, other factors such as question wording and practical challenges inherent in survey administration can introduce additional error or bias into poll findings.
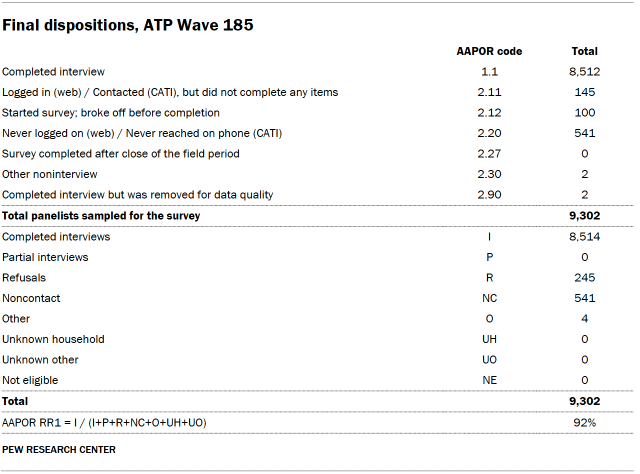
Dispositions and Response Rates: A Comprehensive View
The final disposition of sampled panelists and the resulting response rates are meticulously tracked to provide a transparent account of the survey’s reach and engagement. Detailed tables illustrate the journey of each sampled individual, categorizing them into completed interviews, refusals, non-contactable individuals, and other outcomes. This granular data allows for a thorough assessment of the survey’s effectiveness in reaching its target audience and the factors contributing to response or nonresponse. The cumulative response rate, as previously mentioned, offers a long-term perspective on the panel’s ability to retain and engage its members over time.
Broader Implications and the Value of Rigorous Methodology
The detailed methodology outlined for Wave 185 of the American Trends Panel highlights Pew Research Center’s unwavering commitment to producing high-quality, reliable data. In an era where information is abundant but often of questionable provenance, the rigorous adherence to established research principles—from panel recruitment and sample design to questionnaire development, data collection, and sophisticated weighting techniques—is paramount.
The strategic use of oversampling ensures that the voices of smaller, yet significant, demographic groups are not lost in aggregate data. The dual-channel data collection method (online and telephone) broadens accessibility, accommodating different technological proficiencies and preferences. The comprehensive data quality checks and transparent weighting procedures provide a robust framework for interpreting the survey’s findings.
The insights derived from the ATP, underpinned by this meticulous methodology, are invaluable for policymakers, academics, journalists, and the public. They provide a nuanced understanding of the American public’s views on critical issues, enabling more informed discussions and evidence-based decision-making. The continuous refinement of its methodologies, as evidenced by the evolution of its recruitment strategies and data collection protocols, positions the American Trends Panel as a leading authority in public opinion research, consistently delivering data that shapes our understanding of the nation.


