
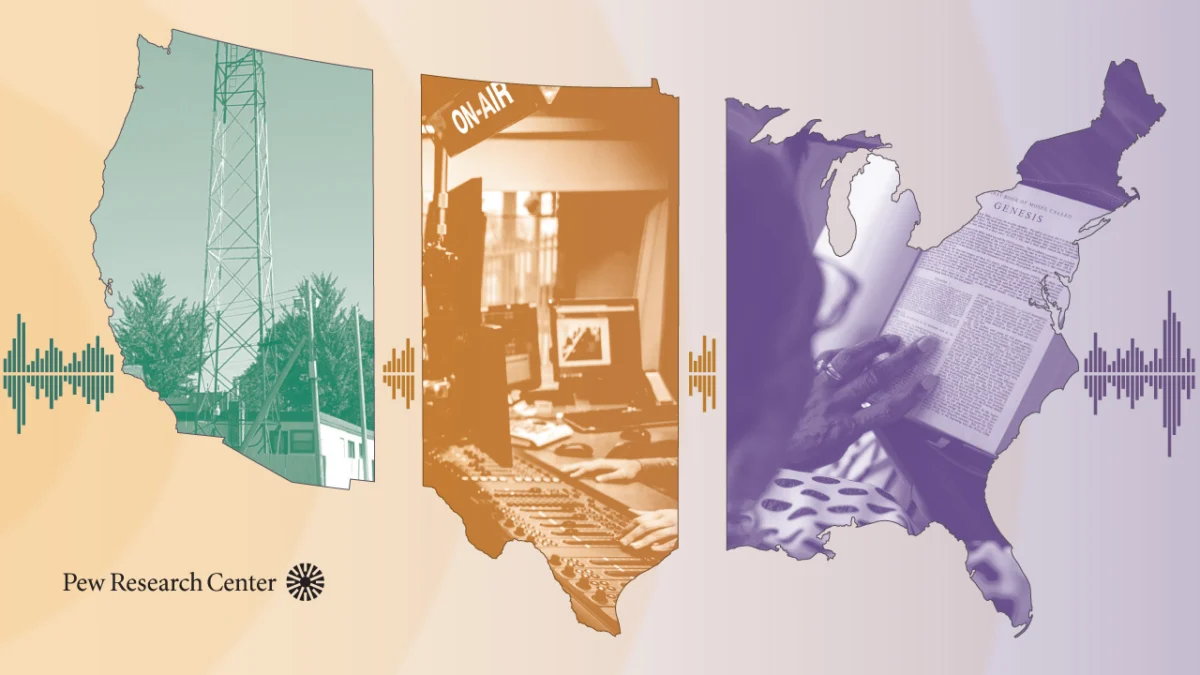
This report delves into the intricate methodologies employed by the Pew Research Center, in collaboration with the Pew-Knight Initiative, to analyze religious radio in the United States. The Pew-Knight Initiative, a joint endeavor funded by The Pew Charitable Trusts and the John S. and James L. Knight Foundation, provides crucial funding for such in-depth research. Further details and related reports can be found at https://www.pewresearch.org/pew-knight/.
The American Trends Panel: A Foundation for Data Collection
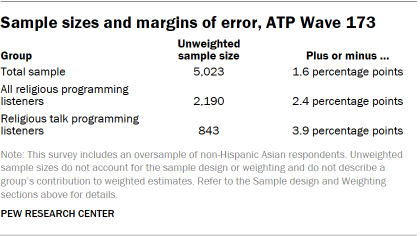
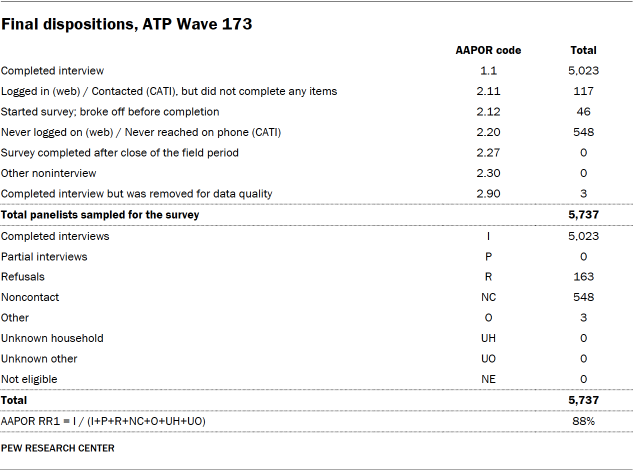
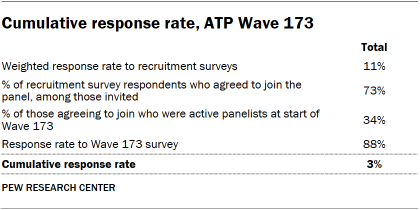
The cornerstone of this study’s data collection is Wave 173 of the American Trends Panel (ATP). This nationally representative panel comprises randomly selected U.S. adults, ensuring a broad and diverse sample. The survey for this wave was conducted from June 9 to June 15, 2025. Out of 5,737 individuals sampled, a robust 5,023 panelists responded, yielding a survey-level response rate of 88%. While the immediate response rate is high, the cumulative response rate, accounting for initial recruitment and ongoing panel attrition, stands at 3%. The break-off rate among panelists who began the survey was minimal, at just 1%. For the full sample of 5,023 respondents, the margin of sampling error is ±1.6 percentage points at a 95% confidence level.

To enhance the precision of estimates for smaller demographic groups, the survey incorporated an oversample of non-Hispanic Asian adults. This strategic inclusion allows for more accurate representation of their opinions and experiences, with oversampled groups subsequently weighted to reflect their correct proportions within the overall U.S. population. The survey was administered by SSRS, utilizing both online (n=4,842) and live telephone (n=181) interviewing methods, with interviews conducted in both English and Spanish. The ATP’s methodology and commitment to rigorous data collection are further detailed in their dedicated resource, "About the American Trends Panel."
Panel Recruitment and Sample Design
Since 2018, the ATP has employed address-based sampling (ABS) for its recruitment efforts. This method involves mailing a cover letter and a pre-incentive to a stratified, random sample of households selected from the U.S. Postal Service’s Computerized Delivery Sequence File, which covers an estimated 90% to 98% of the U.S. population. Within each sampled household, the adult with the next birthday is invited to participate. Prior to 2018, the ATP was recruited through random-digit-dial surveys conducted via landline and cellphone.
The ATP has been recruiting a national sample of U.S. adults annually since 2014. To bolster the accuracy of data for underrepresented groups, specific recruitment efforts, known as oversamples, have been implemented in various years. For instance, Hispanic adults were oversampled in 2019, Black adults in 2022, and Asian adults in 2023.
The sample design for this particular survey targeted noninstitutionalized individuals aged 18 and older residing in the United States. It featured a stratified random sample from the ATP, with non-Hispanic Asian adults selected with certainty. The remaining panelists were sampled to ensure their proportion in each stratum closely mirrored their share of the U.S. adult population. Respondent weights are adjusted to account for these differential selection probabilities.
Questionnaire Development, Incentives, and Data Collection
The questionnaire underwent rigorous development by Pew Research Center in consultation with SSRS. The online survey platform was thoroughly tested on both PC and mobile devices by both the SSRS project team and Pew Research Center researchers. Test data was analyzed to ensure the logic and randomizations functioned as intended before the survey’s launch.
To encourage participation, all respondents received a post-paid incentive, which they could choose as a check or a gift code for major online retailers like Amazon.com, Target.com, or Walmart.com. Incentive amounts varied from $5 to $20, with higher amounts directed towards groups traditionally harder to reach via surveys, aiming to boost participation rates.
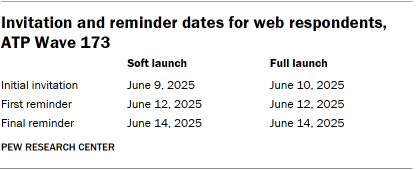
The data collection field period spanned June 9 to June 15, 2025. For online participants, postcard notifications were mailed on June 9, followed by survey invitations sent in two launches: a soft launch of 60 panelists on June 9, and a full launch for all remaining English- and Spanish-speaking online panelists on June 10. Panelists who consented to SMS messages received an invitation and up to two reminders via text.
For telephone interviews, prenotification postcards were mailed on June 6. A soft launch on June 9 aimed to complete seven interviews, followed by dialing all remaining sampled phone panelists throughout the field period. Trained SSRS interviewers could call panelists up to six times.
Data Quality and Weighting
Pew Research Center researchers conducted thorough data quality checks to identify any respondents exhibiting patterns of satisficing, such as unusually high rates of unanswered questions or consistent selection of the first or last response option. Based on these checks, three ATP respondents were removed from the survey dataset before weighting and analysis.
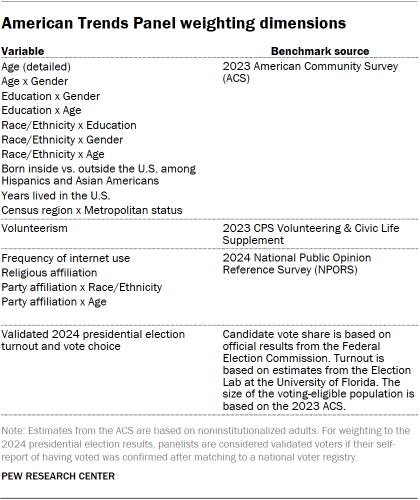
The weighting process for ATP data is multifaceted, accounting for various stages of sampling and nonresponse. Each panelist begins with a base weight reflecting their probability of recruitment. These weights are then calibrated against population benchmarks to correct for nonresponse during recruitment surveys and panel attrition. If a subsample was used for a specific wave, the weight is adjusted to reflect differential selection probabilities. Finally, the weight is recalibrated to align with population benchmarks among survey completers and trimmed at the 1st and 99th percentiles to mitigate precision loss due to weight variance. Sampling errors and statistical significance tests incorporate the effect of this weighting.
Identifying Religious Radio Stations: A Comprehensive Approach
The identification of religious radio stations across the United States relied heavily on data from Radio-Locator, a specialized vendor with up-to-date administrative information on radio stations. Radio-Locator maintains a comprehensive database derived from FCC licensing information, detailing each station’s call sign, location, band, frequency, and licensee. This core data is further enriched with genre, website, live audio stream URL, and coverage area information. For this study, a snapshot of the Radio-Locator database from March 2025 was utilized.
The Radio-Locator database encompassed 25,753 stations across the 50 U.S. states and the District of Columbia. Of these, 17,115 are primary AM or FM stations, while 8,638 are secondary booster or translator stations. While booster and translator stations were considered for estimating geographic coverage, the primary analysis focused solely on primary stations.
Genre Classification and Validation
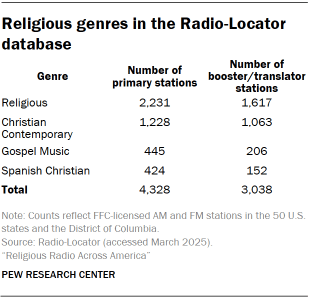
Each station in the Radio-Locator database is assigned a genre label reflecting its primary broadcast content. For this research, a station was categorized as "religious" if its genre was listed as Religious, Christian Contemporary, Gospel Music, or Spanish Christian. This classification identified 7,366 such stations in the database, with 4,328 being primary stations included in the main analysis. While Spanish Christian stations were included in administrative data analyses, including geographic coverage, they were excluded from the live radio content analysis.
The study encountered a limited number of stations broadcasting content from non-Christian religious traditions. Specifically, WMDI-LP in Lakewood, New Jersey, operated by a Jewish organization, and KHQN in Spanish Fork, Utah, operated by a Hare Krishna temple, were identified. Other religious content may appear on public, talk, or community radio stations, but these were not classified as religious stations if religious programming was not their primary genre.
The identification of religious stations was further validated through two key processes:
- Manual Review of Station Websites: Researchers manually reviewed the websites of stations categorized as religious to confirm the nature of their programming and affiliations. This process helped to refine the initial genre-based classification.
- Cross-referencing with Industry Databases: The station list was cross-referenced with other industry databases and directories to ensure comprehensive coverage and accuracy. This step helped to identify any stations that might have been miscategorized or overlooked in the initial Radio-Locator data.
Analysis of Station Websites and Broadcast Schedules
For the 3,332 stations with accessible websites (representing 85% of the included stations), researchers gathered information about the station itself, its affiliated religious tradition or denomination, and any "About Us" statements.
To gain insight into programming diversity, the broadcast schedules of a randomly selected sample of 300 stations (those with both a website and an audio stream URL) were analyzed. Researchers examined each station’s 24-hour schedule, dividing it into 15-minute blocks. They recorded program names, host information, program type (talk or music), and start and end times, rounded to the nearest 15 minutes. Seven days of scheduling information were collected for each sampled station. If schedules varied weekly or monthly, the data from the second week of July 2025 was prioritized; otherwise, the current week’s schedule (April-May 2025) was used. This detailed analysis enabled the estimation of shows appearing on the largest number of stations.
Recording and Analyzing Internet Broadcasts
To thoroughly understand the content of religious radio, a large-scale effort was undertaken to record, transcribe, and analyze internet radio streams from 2,083 religious radio stations broadcasting primarily in English and streaming their live broadcasts online. Due to the common practice of multiple stations sharing a single live broadcast stream, this set of stations was represented by 785 unique web stream URLs.
Sampling Strategy for Recording
The study’s computational capacity allowed for the simultaneous monitoring and recording of 250 audio streams. Instead of recording a subset of stations continuously, the approach was to record all available web streams for intermittent periods. The data collection window spanned the entire month of July 2025. Recording blocks were scheduled every 15 minutes, 24 hours a day, resulting in approximately 24,000 recordings daily, totaling 744,000 over the 31 days. To maximize coverage, when multiple stations shared a single stream, it was included once in the sampling frame, and recordings were assigned to all stations sharing that URL. On average, each station’s web stream received approximately 237 hours of dedicated recording time during the data collection period.
A Note on Educational Media Foundation Stations
The Educational Media Foundation (EMF) is a significant owner of religious radio stations in the U.S., operating the Air1 and K-LOVE networks, which primarily feature Christian music. While on-demand listening is available through proprietary web players and mobile applications, these platforms do not offer publicly accessible stream URLs that could be integrated into the automated recording system. Consequently, EMF stations were excluded from the recorded content analysis but were included in analyses based on administrative data like station counts and geographic coverage.
Recording Infrastructure and Data Capture
The recording process utilized a cluster of 250 containerized stream listener applications. Each listener was programmed with a specific schedule to connect to designated broadcast stream URLs during each 15-minute recording slot. The multimedia framework software FFmpeg was employed to process incoming audio data. After each 15-minute segment, the listener would disconnect and save the recorded audio as a low-bit rate (64 kbps) MP3 file. This methodology successfully captured and processed 716,626 15-minute recordings, achieving 96% of the scheduled time slots. This equates to roughly 230 hours of audio per distinct web stream URL, totaling nearly 440,000 hours when accounting for shared streams.
Speech-to-Text Transcription and Analysis
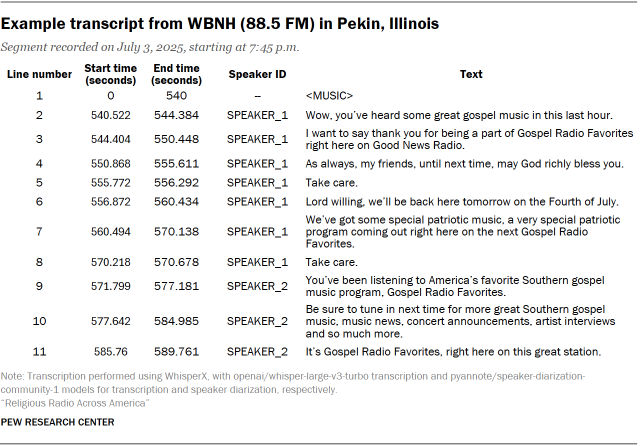
Each recorded audio file underwent a machine transcription pipeline utilizing the WhisperX system. This system extends basic speech-to-text transcription with speaker differentiation (diarization) and time-stamp alignment. The implementation provided line-level transcripts, breaking down spoken content into individual "utterances" with speaker IDs and precise time-stamps. The aggregated transcripts comprised over 186 million lines of dialogue, offering a detailed record of spoken content.
Categorizing Spoken Content
The transcribed audio segments were further processed using a large language model (GPT-4.1) to partition them into substantively coherent topical segments, moving beyond fixed time intervals. The model evaluated speaker turns and lexical continuity to identify segment boundaries, grouping contiguous utterances into segments reflecting a shared format or communicative function (e.g., monologue, interview, news read). Researchers validated these segment breaks through qualitative coding, identifying shifts in subject matter, interactional format, or program structure. The model generated structured metadata, including start and end line numbers and descriptive labels, facilitating segment-level analysis.
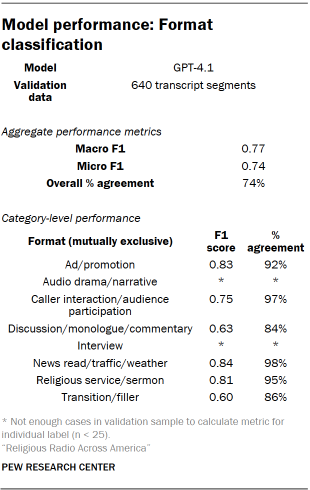
Identifying Radio Segment Formats
The initial classification focused on segment format, identifying the basic type of programming within spoken segments. A codebook was developed with expected format categories, such as talk programming, news reads, sermons, audience participation, and advertisements. Researchers iteratively classified segments, refining the codebook through discussions of disagreements and edge cases until a finalized set of mutually exclusive format categories was established. These categories were then integrated into the processing pipeline and classified by GPT-4.1. A random sample of transcript segments was hand-coded for validation, with disagreements resolved using the Dawid-Skene aggregation model.
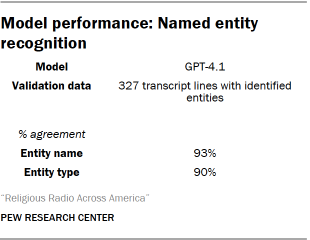
Named Entity Recognition (NER)
Named Entity Recognition (NER) was employed to identify and classify real-world entities within the radio segments. The model was instructed to identify people, groups, and places. Additionally, NER was used to flag titles of stories, books (including religious scriptures), and references to specific scripture passages or verses. Specific NER categories included Person, Group, Place, Religious Text, Scripture Passage, and Other Entity. A sample of identified entities was hand-coded for validation, with disagreements resolved via the Dawid-Skene model.
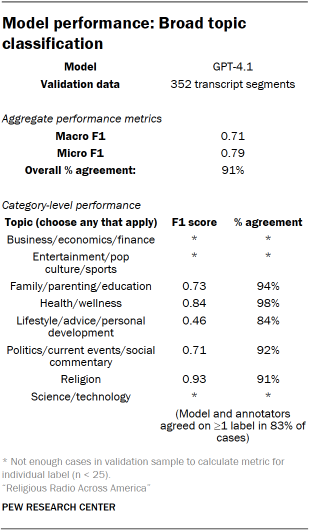
Identifying Broad Topics and Specific Subtopics
Segments were further classified by the topics discussed. These labels were designed to reflect general, high-level topical areas for broad categorization of religious talk radio content. Through an iterative human coding process, a final list of non-mutually exclusive topic categories was determined, including Religion, Politics/Current Events/Social Commentary, Health/Wellness, Business/Economy/Finance, and Science/Technology.
For segments labeled with these broad topics, a subtopic model was employed to identify more specific areas of discussion. Subtopics were also non-mutually exclusive. For segments categorized under "Religion," specific subtopics included Bible Study, Christian Doctrine, Prayer, Worship, Church Life, and Religious Leaders. Within "Politics/Current Events/Social Commentary," subtopics ranged from specific political figures and policies to social issues and community engagement. Similar detailed subtopic classifications were developed for Health/Wellness, Business/Economy/Finance, and Science/Technology.
Classifying Issue Stance and Speaker Gender
Beyond topical classification, a stance classification system was developed to assess speakers’ attitudes towards key issues. This system determined whether a text was neutral or opinionated, and if opinionated, whether the expressed opinion was favorable or unfavorable towards the issue. Stance was coded for a selection of issues, individuals, and groups derived from NER and subtopic classification. Most issues were coded as neutral or opinionated (favorable/unfavorable), while crime/law enforcement and economy subtopics were only coded as neutral or opinionated.
A comprehensive list of issues, individuals, and groups analyzed for stance included: Abortion, LGBTQ+ Rights, Immigration, Gun Control, Climate Change, Christianity, Islam, Judaism, Political Parties (Democratic, Republican), Specific Politicians (e.g., President Biden, Donald Trump), and Religious Leaders.
To estimate speaker gender, the pretrained wav2vec2 model audeering/wav2vec2-large-robust-24-ft-age-gender was utilized. This model, fine-tuned for age and gender prediction, processed extracted audio clips corresponding to each speaker’s utterances. The model outputs a probabilistic gender classification (male/female) based on vocal characteristics. Aggregated predictions at the speaker level assigned a single gender classification. A researcher validated the model’s predictions on a sample of 50 utterances, achieving 98% accuracy.
Identifying Musical Content
Differentiating Music from Speech
A crucial initial step in processing the recorded audio was distinguishing between music and spoken content. This was achieved using the MIT/ast-finetuned-audioset-10-10-0.4593 Audio Spectrogram Transformer (AST) model. The model was adapted to the 15-minute recordings by chunking them into overlapping 10-second segments. Segments were classified as speech or music independently and then merged into continuous regions of each category. Segments where the model identified both speech and music were classified as speech. Transcripts for music segments were notated as .
Identifying Tracks, Artists, and Genres
To identify specific musical tracks, artists, and genres, the AudD music recognition API was employed. Randomly sampled clips from the recorded audio containing at least two minutes of continuous music were analyzed. This process identified 39,262 distinct tracks by 13,594 artists. Approximately 93% of these tracks had associated metadata in the Spotify music library, allowing for the retrieval of detailed artist and genre information. Genre tags were reviewed and consolidated into standardized categories for analysis, encompassing a wide spectrum of musical styles prevalent in religious radio programming.
Mapping Programming Categories onto a 24-Hour Schedule
The content analysis is based on approximately 440,000 hours of recorded audio. Since recordings were made in 15-minute blocks, the reported "hours per day" figures are calculated proportions of observed content, assuming a 24-hour broadcast schedule. This assumption was validated by the lack of significant overnight sign-offs and minimal dead air observed in the recordings. Analysis indicated that, on average, less than 30 seconds of silence occurred within a 15-minute recording block, with no significant difference between overnight and daytime periods. This methodological rigor ensures a comprehensive and accurate portrayal of the religious radio landscape in the United States.


