

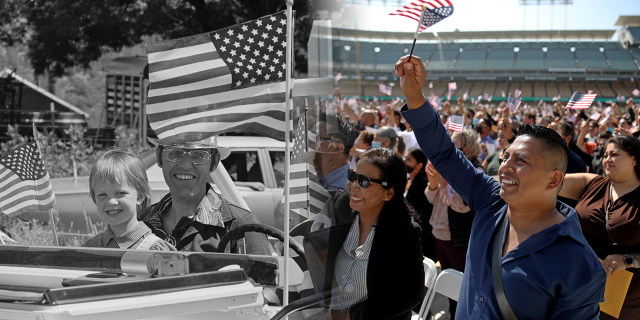
As the United States approaches its 250th anniversary on July 4, 2026, a profound transformation of American society is evident when compared to its bicentennial celebration in 1976. The nation, which then marked 200 years of independence, has undergone seismic shifts in its demographics, workforce, family structures, and economic landscape. These changes, driven by immigration, longer life expectancies, evolving social norms, and economic restructuring, paint a picture of a nation both familiar and strikingly different from its mid-20th-century iteration.
The U.S. Census Bureau data, spanning from 1970 to 2024, reveals a nation that has grown by over 120 million people, now nearing 340 million. This expansion is not merely a matter of numbers but reflects fundamental alterations in the fabric of American life. The once-dominant demographic profile is yielding to a more diverse and aged populace, while the very definition of the American family and the nature of work have been redefined.
A Nation Remade: Key Transformations Since the Bicentennial
Fifty years ago, the United States celebrated its bicentennial amidst a period of significant cultural and social change. The intervening decades have amplified these trends and introduced new dynamics, creating a nation that is older, more diverse, and economically stratified.
Demographics: An Aging and Diversifying America

The most striking demographic shift is the aging of the U.S. population. In 1970, approximately 10% of Americans were 65 or older. By 2024, this figure has nearly doubled to 18%, a substantial increase that has profound implications for healthcare, social security, and the labor market. This aging trend is observed across all racial and ethnic groups, though White and Black Americans have experienced the most pronounced increases in their median age.
Concurrent with this aging, the United States has become significantly more racially and ethnically diverse. The proportion of the population identifying as non-Hispanic White has steadily declined since 1970, while the Hispanic population has more than quadrupled. This diversification is particularly evident in the South and West, where White Americans now constitute roughly half or less of the population in many areas.
Immigration has been a powerful engine of this demographic evolution. The percentage of foreign-born individuals in the U.S. population has more than tripled since 1970, rising from a historical low of 4.7% to 14.8% in 2024. This influx is most pronounced among Asian and Hispanic communities and has significantly reshaped the demographic makeup of regions like the West and the Northeast.
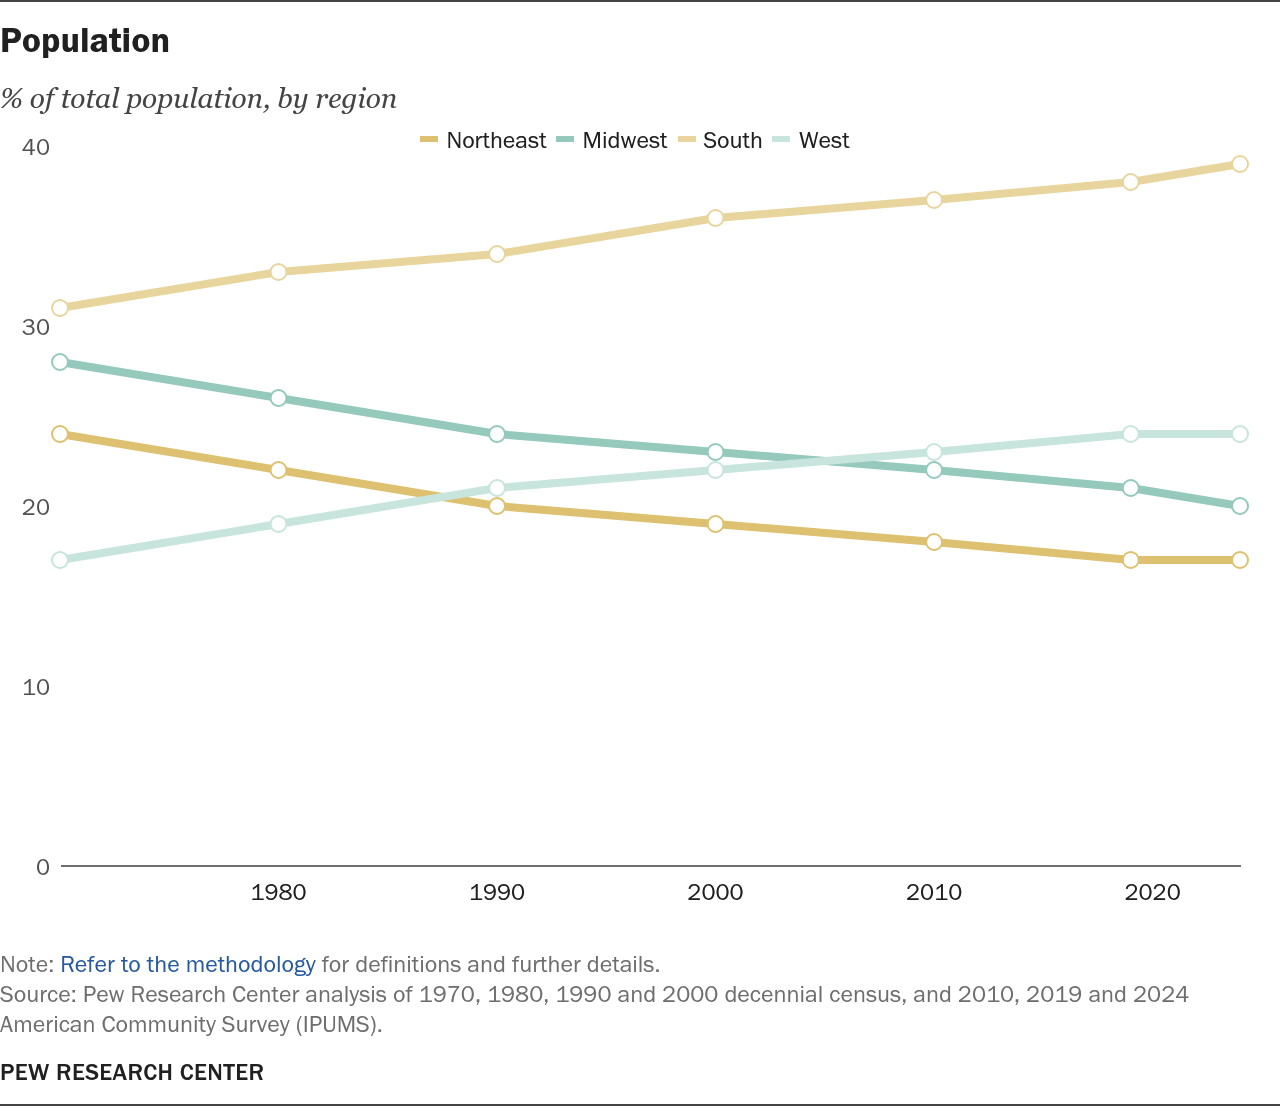
Geographically, a substantial internal migration has occurred, with a significant movement of Americans towards the Sunbelt states. In 1970, less than half of the U.S. population resided in the South (31%) and West (17%). Today, more than six in ten Americans call these regions home, reflecting shifts in economic opportunities, climate preferences, and lifestyle choices.
Workforce: Education, Empowerment, and Economic Disparities
The American economy has transitioned from an industrial base to one increasingly reliant on services and information. This transformation has been mirrored in the workforce, with significant gains in higher education attainment. In 1970, only 11% of adults held a bachelor’s degree or higher; by 2024, this figure has more than tripled to 37%. This educational expansion has been more pronounced among women, who have increasingly pursued higher education and entered professions previously dominated by men.
The participation of women in the labor force has been a defining feature of the past five decades. While overall labor force participation has seen modest growth, this is largely attributable to the surge in women entering and remaining in paid employment. Conversely, male labor force participation has seen a decline. This shift has not only altered household dynamics but has also contributed to the growth of the overall U.S. labor force.
Despite these advancements, economic disparities have widened. While the median inflation-adjusted earnings of workers have increased since 1970, these gains have disproportionately benefited those with higher education. Workers with less than a four-year college degree have seen more modest wage growth, contributing to a growing gap between the highly educated and those with less formal schooling.
Family: Redefining Households and Relationships
The traditional American family structure has undergone a significant metamorphosis. Americans are marrying and having children at later ages, and fewer are doing so overall. The share of adults who are currently married has fallen from 69% in 1970 to 50% in 2024. This decline is particularly steep among adults without a four-year college degree.
Fertility rates have also decreased. The average number of children born to women aged 40 to 44 has fallen from approximately three in the 1970s to around two since 1990. This trend is attributed to various factors, including increased access to contraception, later marriages, and the rising employment of women.
Living arrangements have also diversified. A smaller proportion of children now live with two married parents compared to 50 years ago. Simultaneously, there has been a notable increase in multigenerational households, where more than one adult generation lives under the same roof. This trend is more pronounced among Black, Hispanic, and Asian American populations, with nearly 30% of these groups living in such arrangements, compared to 16% of White Americans. These evolving family structures reflect changing economic realities, cultural norms, and the need for familial support networks.

Economics: Shifting Tides and Persistent Gaps
The economic landscape has also been reshaped. While the overall U.S. economy has grown, leading to a decline in the poverty rate, particularly among older Americans, the distribution of this prosperity has been uneven. The middle class has shrunk, with a larger share of adults now categorized as lower-income, while the upper-income tier has also expanded. This polarization suggests a hollowing out of the economic center, leading to increased economic stratification.
Homeownership rates have seen only modest gains since 1970. While ownership has expanded for those aged 65 and older, it has slightly decreased for adults aged 18 to 64, indicating potential affordability challenges for younger generations.
A Historical Perspective: Milestones and Data
The Pew Research Center’s analysis, drawing from U.S. Census Bureau data collected between 1970 and 2024, provides a granular view of these societal transformations. This comparative approach allows for a direct assessment of how key indicators have evolved since the nation’s bicentennial.

- 1976 Bicentennial: A nation celebrating its 200th anniversary, with a population of approximately 218 million. The economic landscape was still largely industrial, and social norms around family and gender roles were undergoing shifts but were still more traditional than today. Immigration was at a low ebb.
- 1990s and Early 2000s: The dot-com boom and the rise of the internet began to reshape the economy, accelerating the shift towards information-based industries. Immigration began to increase more significantly.
- 2008 Financial Crisis: This event had a profound impact on economic security, exacerbating income inequality and influencing attitudes towards work and financial stability.
- Present Day (2026 Approach): A nation grappling with the implications of its demographic diversity, an aging population, evolving family structures, and persistent economic disparities, all set against a backdrop of technological advancement and global interconnectedness.
The data underscores the dynamic nature of American society. The "Sunbelt" expansion, for instance, represents a significant geographical redistribution of the population, with states in the South and West experiencing substantial growth. This migration pattern has implications for infrastructure development, resource allocation, and political representation.
Implications for the Future
The transformations detailed by the Pew Research Center analysis carry significant implications for the United States as it approaches its 250th anniversary. The aging population will place increased demand on social security and healthcare systems, necessitating policy reforms. The growing diversity of the nation presents both opportunities for cultural enrichment and challenges in fostering social cohesion and equitable representation.
The widening economic gaps suggest a need for policies aimed at promoting upward mobility and ensuring that the benefits of economic growth are more broadly shared. The changing family structures indicate a need for flexible social support systems that can accommodate diverse household arrangements and evolving parental roles.
As the nation looks towards its next half-century, understanding these profound shifts is crucial. The United States at 250 is a testament to the enduring capacity for change and adaptation, a nation continually redefining itself through the collective experiences of its people. The trends identified by Pew Research Center serve as a vital roadmap for navigating the challenges and opportunities that lie ahead.

Methodology and Scope
This Pew Research Center analysis focuses on key changes in U.S. society since the bicentennial, utilizing U.S. Census Bureau data from 1970 to 2024. The study prioritizes demographic shifts, workforce evolution, family structure changes, and economic outcomes. It acknowledges that other significant societal transformations, such as shifts in the religious landscape, LGBTQ+ rights and acceptance, and the political environment, are not covered in this particular report but are areas where the Center also conducts research. The historical comparison is limited by the availability of systematic data collection, which became more robust in the 20th century. Pre-1970 data is excluded due to limitations in systematic data collection for many key characteristics and the establishment of the country’s present boundaries in 1959. Detailed methodology, including definitions and further specifics, is available in a dedicated document.


