
Pew Research Center’s 2025 Cross-Sectional Engagement Survey, conducted by SSRS, employed a rigorous, multi-modal methodology to capture a comprehensive understanding of American civic and political engagement. Fielded from July 9 to December 5, 2025, the survey utilized address-based sampling and a strategic outreach protocol designed to maximize response rates across diverse demographics. The findings of this extensive survey provide critical insights into how Americans participate in public life, from political activities to community involvement and news consumption.
Survey Design and Execution
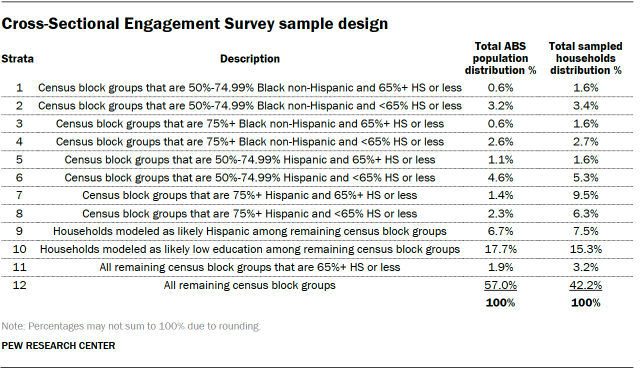
The core of the 2025 Cross-Sectional Engagement Survey relied on a sophisticated sampling frame drawn from the U.S. Postal Service’s Computerized Delivery Sequence File. This address-based sampling (ABS) approach ensured that virtually all occupied residential addresses across the United States, including Alaska and Hawaii, had an equal opportunity of selection. The sampling design was a national, stratified random sample, with probabilities of selection carefully adjusted across mutually exclusive strata to ensure representativeness.

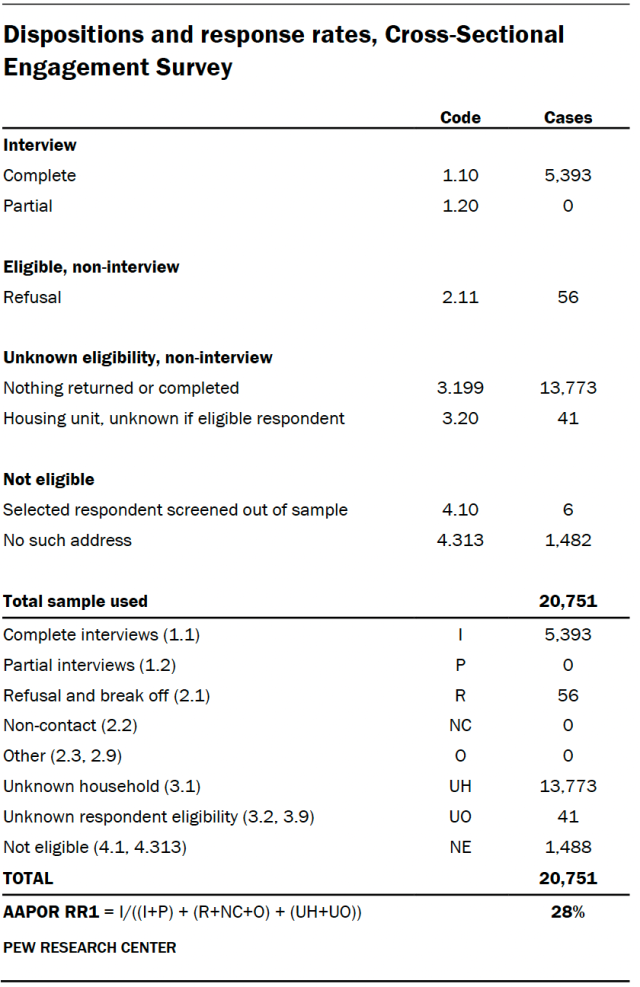
SSRS managed the complex fieldwork, initiating contact with 20,751 sampled addresses. The initial outreach involved a 9-by-12-inch window envelope sent via first-class mail. Crucially, these packets included a visible $1 bill to incentivize opening and engagement, a tactic designed to capture attention in a crowded postal landscape. The accompanying letter invited a household member to complete the survey, providing multiple avenues for participation: a dedicated URL for an online survey, a toll-free number for telephone interviews, and a password for secure access. To ensure accurate representation within households, the letter instructed the adult with the next birthday to complete the survey, a standard practice in survey methodology to avoid self-selection bias.
Beyond the primary survey invitation, two embedded experiments were integrated into this initial mailing. The first experiment tested the impact of QR codes on response rates; 65% of the letters included a QR code for direct access to the online survey. The second experiment aimed to gauge the effect of different incentive levels, with 65% of letters containing two $1 bills and the remaining 35% including a single $1 bill. These experimental conditions were fully and randomly crossed to allow for robust analysis of their respective impacts.
For households that did not respond to the initial mailing, a series of follow-up communications were initiated. A reminder postcard was sent, followed by a reminder letter, both via first-class mail. This systematic follow-up strategy is vital for maximizing survey participation and is a hallmark of well-designed data collection efforts.
Recognizing the importance of reaching a diverse population, materials were distributed in both English and Spanish. Households in identified Hispanic strata, along with additional sampled records predicted to be Hispanic, received all survey materials in both languages. All other households received English-language materials.
To further bolster participation, a multi-stage incentive strategy was employed. After the online survey period concluded, non-responding households with deliverable addresses received a second mailing, this time via Priority Mail. This package contained a $5 bill, a paper version of the survey, and a postage-paid return envelope. The paper survey was a compact, 11-by-17-inch booklet. A subsequent reminder mailing, also containing a copy of the paper questionnaire, was sent via first-class mail to further encourage completion. Respondents who successfully completed the survey at any stage were sent a $10 post-paid incentive as a token of appreciation for their time and contribution.
The initial mailing was strategically launched in two phases: a soft launch encompassing 5% of the sample, sent a few days prior to the full launch, which included the remaining 95% of the sampled addresses. This phased approach allows for early identification and resolution of any unforeseen issues before full-scale deployment.
Questionnaire Development and Data Collection
The questionnaire itself was meticulously developed by Pew Research Center in close consultation with SSRS. Rigorous testing of the online questionnaire was conducted on both desktop and mobile devices to ensure functionality, logical flow, and accurate randomization of question order. Test data was analyzed to confirm that all programmed logic and randomizations operated as intended before the survey went live.
The survey was administered using a multimode protocol, offering respondents the flexibility to participate online, via mail, or by phone. This approach caters to varying preferences and technological access among the population. A total of 5,393 respondents completed the survey: 2,705 online, 2,500 via paper mail, and 188 by phone with a live interviewer. The survey was administered in English and Spanish. The American Association for Public Opinion Research (AAPOR) Response Rate 1 for the survey was 28%, a metric that reflects the proportion of completed interviews among all eligible and potentially eligible units.
Sample Definition and Weighting
The sample for the 2025 Cross-Sectional Engagement Survey was designed to be nationally representative of U.S. adults. Occupied residential addresses, including "drop points," were included, ensuring broad coverage. The sampling plan, detailed in accompanying tables, aimed to achieve differential probabilities of selection across strata to ensure sufficient representation of key demographic and geographic groups.

To ensure that the survey data accurately reflects the U.S. adult population, a multi-step weighting process was implemented. This process begins with a base weight, which corrects for the differential probabilities of selecting an address and accounts for the number of adults residing in a household. An adaptive mode adjustment was also incorporated to account for differences in response propensity between online and offline (mail/phone) modes.
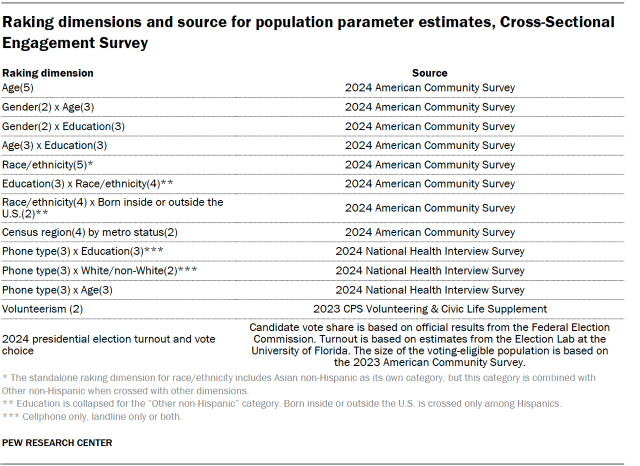
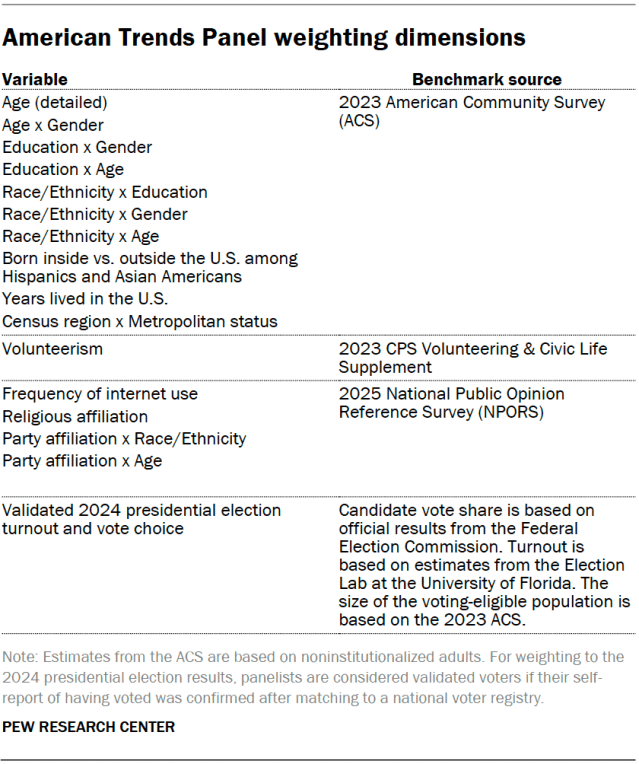
Following the base weight calculation, the data undergoes raking calibration, an iterative proportional fitting process. This calibration aligns the survey data with established population benchmarks for key demographic variables. These benchmarks, derived from authoritative sources, ensure that the weighted sample accurately mirrors the composition of the U.S. adult population in terms of age, gender, race, ethnicity, education, and other critical characteristics. The specific raking dimensions and their corresponding population parameter estimates are detailed in supplementary tables. All raking targets were based on the noninstitutionalized U.S. adult population, aged 18 and older. To mitigate the impact of extreme weights on survey precision, weights were trimmed at the 1st and 99th percentiles.
Design Effect and Margin of Error
Survey estimates are subject to sampling error, which is the error inherent in any survey that relies on a sample rather than a complete census. The design effect (deff) quantifies the impact of complex survey design features, such as stratification and weighting, on the variance of survey estimates compared to a simple random sample. A higher design effect indicates that the complex design has increased the variance of estimates.
For the 2025 Cross-Sectional Engagement Survey, the margin of error for full sample estimates at the 50% level of confidence is plus or minus 1.9 percentage points. This margin of error incorporates the design effect. It is important to note that estimates derived from subgroups (e.g., specific age groups, racial or ethnic categories) will have larger margins of error due to smaller sample sizes within those subgroups. Researchers and consumers of the data are reminded that sampling error is only one potential source of error; other factors, such as question wording, respondent recall, and reporting inaccuracies, can also influence survey findings.
The American Trends Panel (ATP) Methodology
In addition to the cross-sectional survey, this report draws upon data from Wave 179 of the American Trends Panel (ATP), Pew Research Center’s ongoing, nationally representative panel of U.S. adults. The ATP is a vital resource for longitudinal research and for studying smaller demographic subgroups with greater precision.
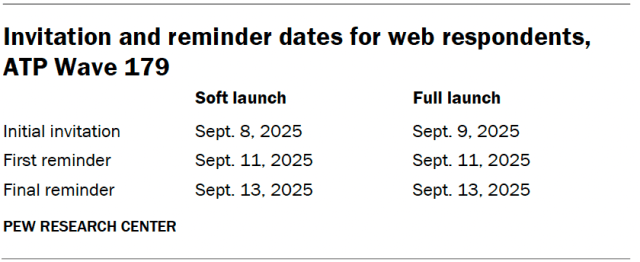
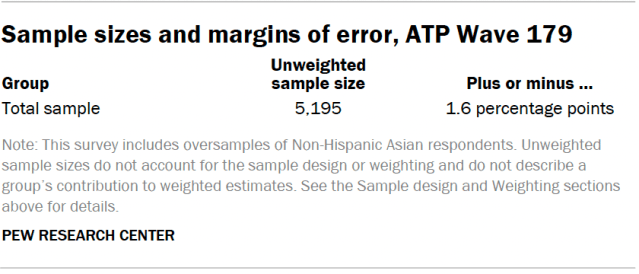
Wave 179 of the ATP was conducted from September 8 to September 14, 2025, with a total of 5,195 panelists responding out of 5,852 sampled. This resulted in a survey-level response rate of 89%. The cumulative response rate, accounting for initial recruitment and ongoing panel attrition, is 3%. The break-off rate, measuring the proportion of panelists who started the survey but did not complete it, was less than 1%, indicating high engagement among those who logged in. The margin of sampling error for the full ATP sample of 5,195 respondents is plus or minus 1.6 percentage points.
To enhance the precision of estimates for specific demographic groups, the ATP incorporates an oversample of non-Hispanic Asian adults. These oversampled groups are subsequently weighted back to their correct proportions in the overall U.S. population to ensure the integrity of national estimates.
SSRS conducted Wave 179 of the ATP survey, utilizing both online (n=4,986) and live telephone interviewing (n=209) modalities. Interviews were available in English and Spanish. The ATP’s recruitment strategy, predominantly using address-based sampling since 2018, draws from the U.S. Postal Service’s Computerized Delivery Sequence File, which covers an estimated 90% to 98% of U.S. households. This ensures a robust and representative recruitment pool. Incentives, ranging from $5 to $15, are offered to panelists based on their demographic characteristics, with higher amounts provided to those in harder-to-reach groups, aiming to boost participation among populations historically less inclined to respond to surveys.
Engagement Group Creation and Analysis
A key innovation of this research is the creation of four distinct "engagement groups" derived from the 2025 Cross-Sectional Engagement Survey data. This classification was achieved through a weighted cluster analysis, a statistical technique that identifies individuals with similar patterns of behavior across a range of civic and political activities. The analysis utilized responses to 19 specific questions measuring participation in areas such as volunteering, group membership, news consumption, political donations, and civic actions like contacting elected officials or participating in demonstrations.
The clustering algorithm, weighted clustering around medoids (using the WeightedCluster package in R), treats each of the 19 behavioral items as equally important in defining group membership. This methodological choice allows for a nuanced understanding of how different combinations of activities define varying levels and types of engagement. The selection of these 19 items was based on extensive testing to identify a model that not only fit the data well but also produced groups with substantive meaning.
The analysis also involved careful data cleaning. Respondents who did not provide answers to nine or more of the 19 clustering items were excluded from the analysis (n=13) to ensure reliable classification. For the remaining respondents (n=5,380 unweighted), missing values for individual items were not imputed, as the chosen distance metric (Gower’s distance) can accommodate mixed data types and calculate distances based on available responses, thus preserving respondents with partial data.
The selection of the optimal number of clusters was a critical decision, involving the examination of solutions with varying numbers of groups. The four-group solution was chosen for its balance of cohesiveness within groups, distinctiveness between groups, and practical analytical utility. The robustness of the k-medoids algorithm was confirmed by running models multiple times with different initial conditions, consistently yielding the same results.
Projecting Engagement Clusters to the ATP
To enable further analysis of attitudes and civic knowledge in relation to engagement, the engagement clusters derived from the cross-sectional survey were projected onto Wave 179 of the American Trends Panel. This was achieved by assigning ATP respondents to the closest engagement group based on their behavioral patterns, using Gower’s distance to measure similarity. This linkage allows researchers to analyze attitudinal and knowledge data from the ATP while maintaining the engagement group classifications rooted in the cross-sectional survey, providing a richer, more comprehensive picture of American engagement. The ATP results generally mirrored the engagement patterns and demographic profiles observed in the cross-sectional survey, reinforcing the validity of the derived engagement groups.
This detailed methodological approach underscores Pew Research Center’s commitment to producing high-quality, reliable data that informs public understanding of critical social and political issues. The 2025 Cross-Sectional Engagement Survey and its integration with the American Trends Panel provide a robust foundation for analyzing the multifaceted nature of civic participation in the United States.