
Pew Research Center’s American Trends Panel (ATP) conducted its 191st wave of surveys from April 6-12, 2026, gathering critical data from a nationally representative sample of U.S. adults. This comprehensive methodology report details the rigorous processes employed to ensure the accuracy and reliability of the findings, which are foundational to understanding public opinion on a range of contemporary issues. The survey achieved a robust 95% survey-level response rate, with 3,592 panelists completing the questionnaire out of 3,775 who were initially sampled. While the cumulative response rate, accounting for recruitment and attrition, stands at 3%, and the break-off rate among active participants was less than 1%, these figures reflect the challenges inherent in maintaining a long-term, nationally representative panel. The margin of sampling error for the full sample is a precise plus or minus 1.9 percentage points, a testament to the survey’s statistical rigor.
To enhance the precision of estimates for smaller demographic subgroups, the ATP strategically employed oversampling techniques. This included targeted recruitment of non-Hispanic Asian adults, White evangelical Protestants who attend church monthly, White nonevangelical Protestants who attend church monthly, Black Protestants who attend church monthly, and Catholics who attend church monthly. These oversampled groups, crucial for nuanced analysis, are subsequently weighted back to accurately reflect their proportions within the broader U.S. adult population, ensuring that their unique perspectives are appropriately represented in the final analysis. The survey data was collected by SSRS, employing a dual-mode approach that combined online interviews with live telephone interviewing, ensuring accessibility for a diverse range of respondents. A total of 3,491 participants completed the survey online, while 101 engaged via live telephone. Interviews were conducted in both English and Spanish, further broadening the inclusivity of the data collection. For those seeking deeper insights into the ATP’s operational framework, extensive documentation is available on the Pew Research Center’s official website.

Panel Recruitment: A Decade of Evolving Methodologies
The foundation of the ATP’s strength lies in its decade-long commitment to building and maintaining a diverse, nationally representative panel of U.S. adults. Since 2018, the panel has utilized a sophisticated address-based sampling (ABS) methodology for recruitment. This process begins with mailing study cover letters and pre-incentives to a stratified, random sample of households drawn from the U.S. Postal Service’s Computerized Delivery Sequence File, a database estimated to cover between 90% and 98% of the nation’s population. Within each selected household, the adult whose birthday falls next is designated as the potential participant. While the specifics of the ABS recruitment protocol have evolved since its inception, the core principle of random household selection remains. Prior to 2018, the ATP relied on traditional landline and cellphone random-digit-dial surveys, administered in both English and Spanish, to populate its panel.
The ATP has undertaken national recruitment efforts approximately annually since 2014. In certain years, these efforts have included supplementary recruitment drives, known as "oversamples," specifically designed to bolster the representation of underrepresented demographic groups. For instance, Hispanic adults were oversampled in 2019, Black adults in 2022, and Asian adults in 2023. These targeted recruitment campaigns are essential for ensuring that the panel can provide reliable data on the opinions and experiences of diverse segments of the American population, particularly those whose voices might otherwise be diminished in a standard probability sample. The continuity and evolution of these recruitment strategies underscore the Pew Research Center’s dedication to adapting to best practices in survey research.
Sample Design: Ensuring Representativeness and Precision
The overarching target population for this specific survey wave comprised noninstitutionalized individuals aged 18 and older residing in the United States. The sample design for Wave 191 of the ATP was meticulously crafted to ensure both broad representativeness and the capacity for detailed analysis of key subgroups. This was achieved through a stratified random sample drawn from the ATP panel itself. The stratification strategy specifically prioritized the oversampling of several important demographic and religious groups: non-Hispanic Asian adults, White evangelical Protestants who attend church monthly, White nonevangelical Protestants who attend church monthly, Black Protestants who attend church monthly, and Catholics who attend church monthly.
The selection of panelists from the ATP for this wave was conducted at rates designed to maintain proportionality to each stratum’s share of the U.S. adult population to the greatest extent feasible. Following data collection, respondent weights are rigorously adjusted to correct for any differential probabilities of selection that may have occurred during the sampling process, as further detailed in the weighting section. This intricate balancing act between oversampling for precision and weighting for population accuracy is a hallmark of sophisticated survey research, allowing for both granular insights into specific communities and a reliable overview of national sentiment.
Questionnaire Development and Testing: A Commitment to Clarity and Accuracy
The development of the survey questionnaire for Wave 191 was a collaborative effort between Pew Research Center’s research staff and SSRS, the survey research firm responsible for data collection. This collaborative process ensures that the questions are not only relevant to current research objectives but are also phrased in a clear, unbiased, and easily understandable manner for a diverse respondent population. Prior to full deployment, the web-based survey instrument underwent extensive testing by both the SSRS project team and Pew Research Center researchers. This rigorous testing phase, conducted on both personal computers and mobile devices, was crucial for identifying and rectifying any technical glitches, ensuring logical flow, and verifying that any programmed randomizations functioned precisely as intended. Test data was meticulously analyzed using SPSS to confirm the integrity of the survey’s architecture before its official launch, thereby safeguarding the quality and reliability of the collected data from the outset.
Incentives: Fostering Participation and Equity
To encourage robust participation and acknowledge the valuable time and effort of panelists, all respondents were offered a post-paid incentive. This incentive could be received in the form of a check or as a digital gift code redeemable at major online retailers such as Amazon.com, Target.com, or Walmart.com. The value of the incentive varied, ranging from $5 to $15, with amounts adjusted based on the demographic characteristics of the respondent. Specifically, higher incentives were offered to individuals belonging to groups that are historically more challenging to reach and engage in survey research. This differential incentive strategy is a deliberate design choice aimed at increasing panel survey participation rates among populations that have traditionally exhibited lower survey response propensities, thereby contributing to a more representative and inclusive dataset. This approach acknowledges the economic realities and potential barriers that some individuals may face in participating in research, promoting greater equity in data collection.
Data Collection Protocol: A Multi-Channel Approach
The field period for Wave 191 of the ATP survey spanned from April 6th to April 12th, 2026. Data collection employed a dual-mode strategy, encompassing self-administered web surveys and live telephone interviews, ensuring accessibility for a broad spectrum of the U.S. adult population.
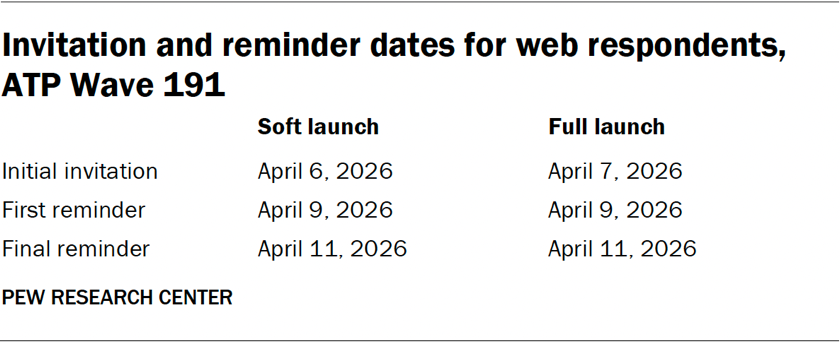
For panelists participating online, the process was initiated with postcard notifications mailed on April 6th to a subset of the sampled individuals. Survey invitations were then disseminated in two distinct phases: a soft launch and a full launch. The soft launch, commencing on April 6th, involved an initial invitation sent to approximately sixty panelists. This controlled rollout allowed researchers to monitor the survey’s performance and address any emergent issues before wider distribution. The full launch, which began on April 7th, encompassed all remaining English- and Spanish-speaking sampled online panelists, who received their initial survey invitations at this time. Panelists who opted to receive communications via SMS were also sent an invitation with a direct link to the survey, supplemented by up to two SMS reminders if they did not immediately respond. Similarly, those participating via email received an initial invitation followed by up to two email reminders.
The data collection for telephone interviews also followed a structured protocol. Prenotification postcards were mailed on April 3rd to inform sampled individuals of the upcoming survey. A soft launch for telephone interviews commenced on April 6th, continuing until five completed interviews were secured. Subsequently, throughout the remainder of the field period, the phone numbers of all remaining English- and Spanish-speaking sampled panelists were dialed by trained SSRS interviewers. Panelists contacted via telephone could receive up to six calls, a strategy designed to maximize the chances of reaching and interviewing potential respondents. This multi-faceted approach to data collection underscores the ATP’s commitment to maximizing response rates and capturing a comprehensive picture of public opinion.
Data Quality Checks: Upholding the Integrity of Findings
Pew Research Center’s commitment to data integrity is paramount, and for Wave 191 of the ATP, a rigorous suite of data quality checks was implemented. Center researchers meticulously examined the collected data for any patterns indicative of satisficing behavior. This involved scrutinizing responses for unusually high rates of unanswered questions or consistent selection of the first or last available answer option, which can signal a lack of engagement with the survey content. As a direct outcome of these critical quality control measures, three respondents whose data exhibited such patterns were excluded from the final survey dataset prior to weighting and analysis. This proactive approach ensures that the reported findings are based on the genuine engagement and considered responses of the participants, thereby reinforcing the reliability and validity of the research.
Weighting: Adjusting for Representation and Nonresponse
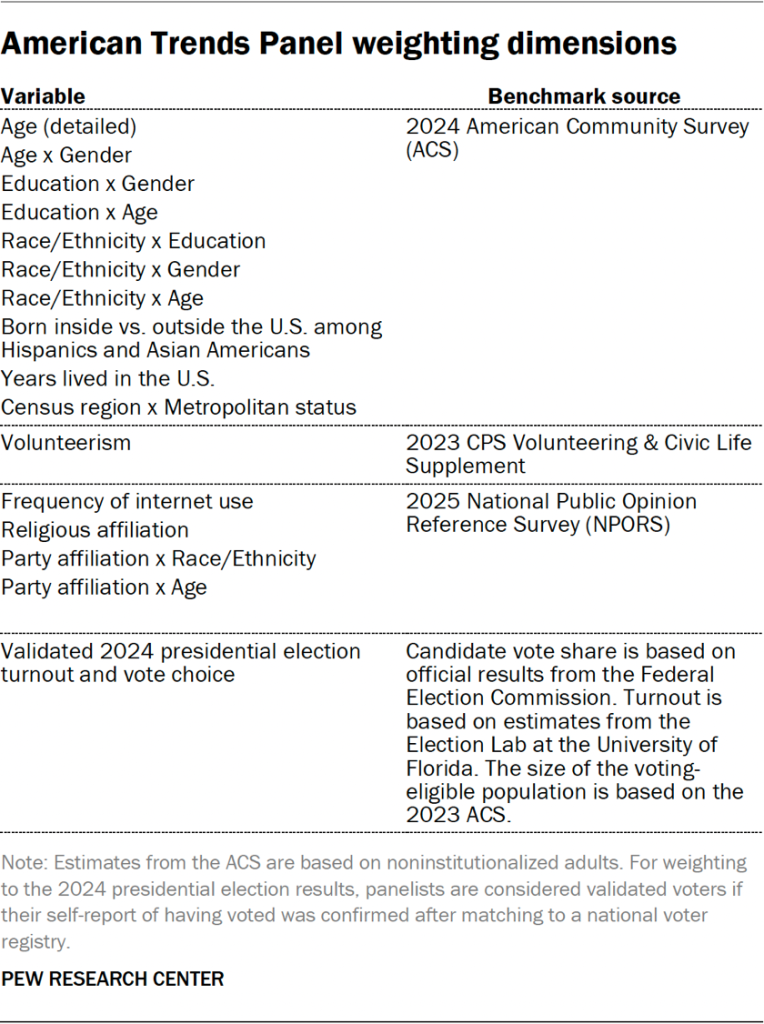
The data collected through the American Trends Panel undergoes a sophisticated weighting process designed to meticulously account for the various stages of sampling and nonresponse that are inherent in longitudinal panel research. Each panelist begins with a base weight that accurately reflects their probability of initial recruitment into the panel. These base weights are then systematically adjusted and calibrated to align with established population benchmarks. This calibration process serves to correct for any nonresponse that occurred during the initial recruitment surveys and for attrition—the natural loss of panelists over time.
Should a specific wave of the survey involve inviting only a subsample of the entire panel, the weights are further adjusted to compensate for any differential probabilities of selection that might have arisen from this subsetting. Following the completion of the survey by the panelists, the weights are again calibrated to match population benchmarks identified in accompanying tables. To mitigate potential losses in precision stemming from extreme weight values, weights are trimmed at the 1st and 99th percentiles. Crucially, all calculations of sampling errors and tests of statistical significance are conducted while taking into account the effects of this comprehensive weighting procedure. This multi-layered approach ensures that the final analysis accurately reflects the U.S. adult population, even in the face of complex sampling and nonresponse challenges.
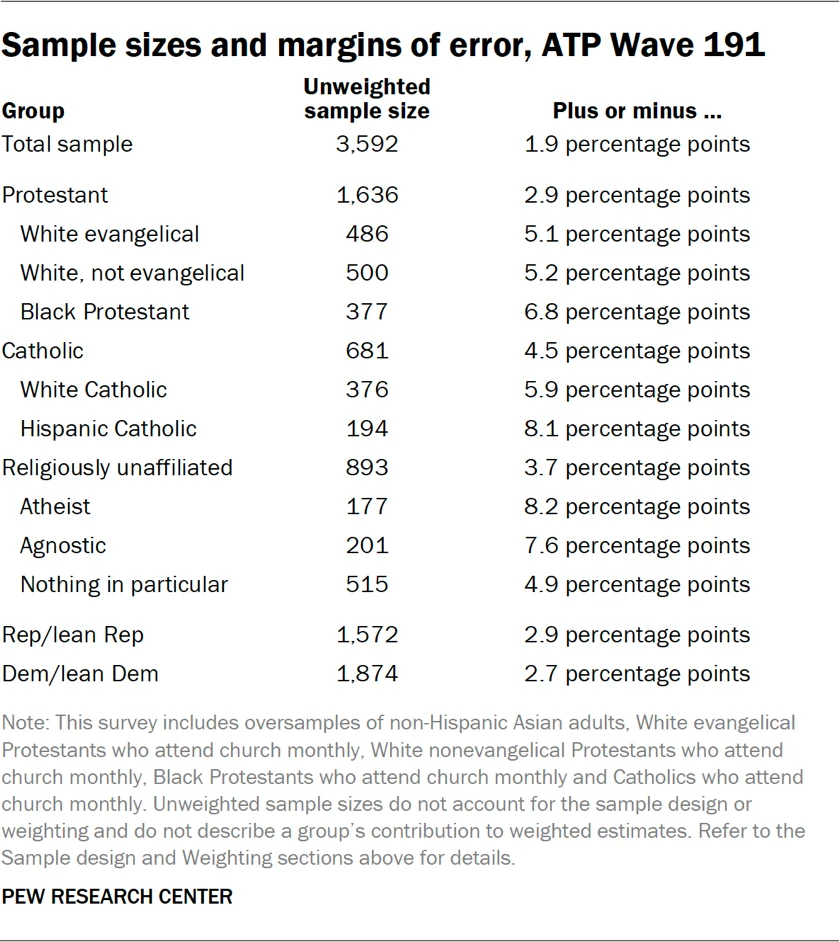
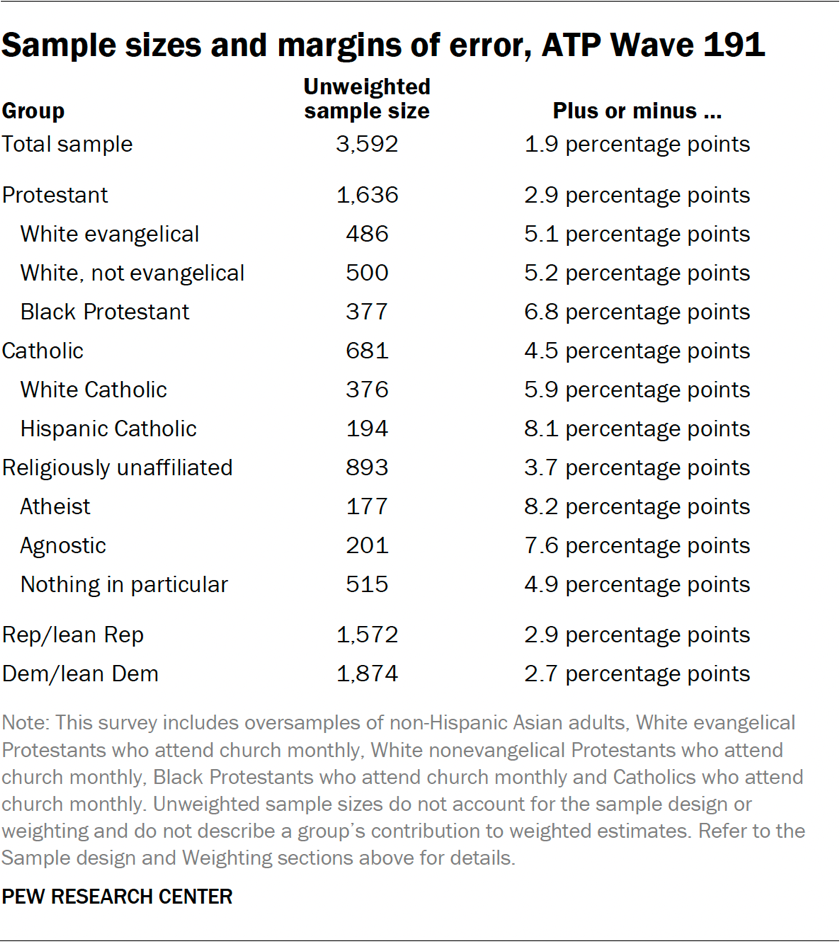
The accompanying tables provide a detailed breakdown of the unweighted sample sizes and the expected margin of error at a 95% confidence level for various demographic groups within the survey. This transparency allows researchers and the public alike to understand the statistical precision of the findings for different segments of the population. Sample sizes and associated sampling errors for other specific subgroups can be made available upon request. It is important to note that in addition to sampling error, potential biases can also be introduced by factors such as question wording and the practical challenges encountered during survey administration. The Pew Research Center remains committed to transparency and rigor in its methodological reporting to ensure the highest standards of research integrity.
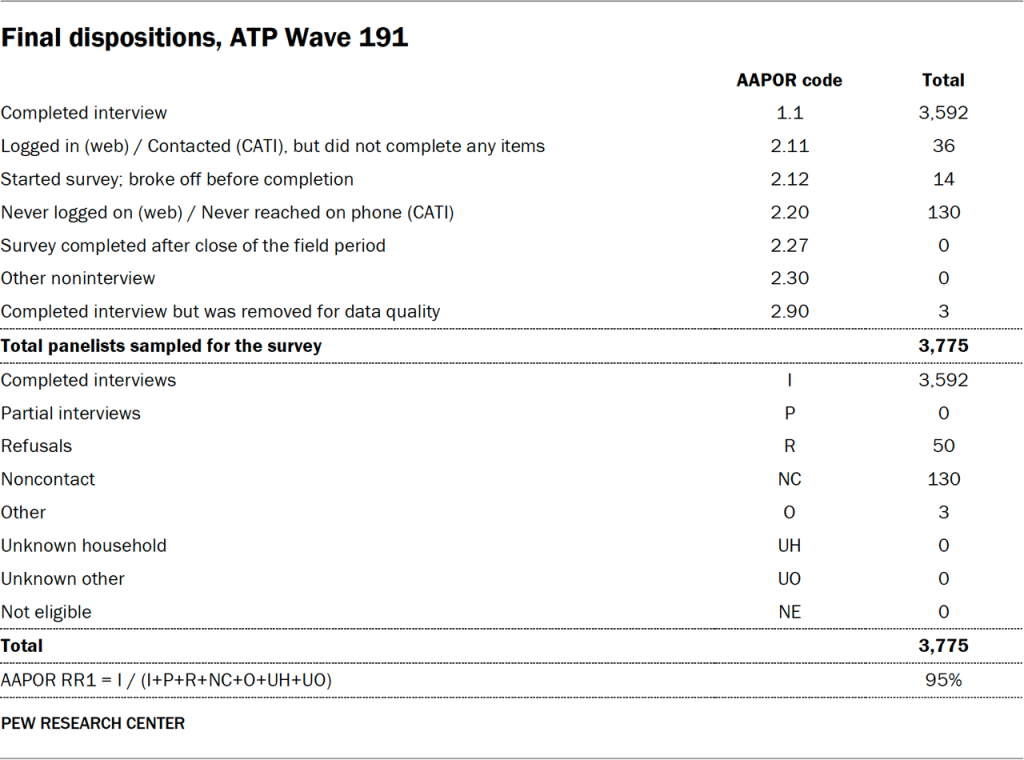
Dispositions and Response Rates: A Comprehensive Overview
The detailed disposition tables provide a granular view of how sampled individuals were categorized throughout the data collection process for ATP Wave 191. These tables offer a clear account of completed interviews, refusals, non-contacted individuals, and other categories that contribute to the overall response rate. The cumulative response rate, which factors in nonresponse at the recruitment stage and ongoing panel attrition, stands at 3%. While this figure may appear low when viewed in isolation, it is a standard metric for long-running panels that accounts for the entire history of a panelist’s engagement. The survey-level response rate, however, which measures the proportion of sampled panelists who completed the specific wave, was a robust 95%. This high survey-level response rate is indicative of the panel’s engaged membership and the effectiveness of the data collection protocols. The break-off rate among panelists who began the survey and completed at least one item was less than 1%, demonstrating strong participant engagement throughout the questionnaire. This detailed breakdown of dispositions and response rates is crucial for understanding the representativeness and potential limitations of the survey data, allowing for informed interpretation of the findings. The accompanying figures offer visual representations of these critical metrics, providing an accessible overview of the survey’s operational success.


