

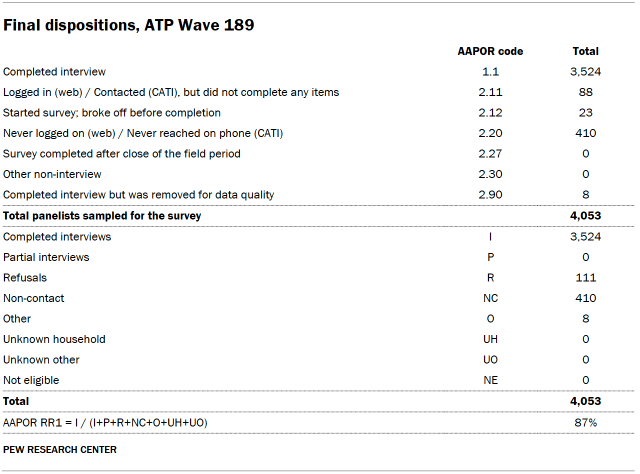
Pew Research Center’s latest report, based on Wave 189 of the American Trends Panel (ATP), provides a detailed account of its rigorous survey methodology. Conducted between March 16 and March 22, 2026, the survey engaged a nationally representative sample of 3,524 U.S. adults out of 4,053 who were initially contacted, achieving a robust survey-level response rate of 87%. This detailed methodology underscores the Center’s commitment to producing reliable and statistically sound data, crucial for understanding the nuances of public opinion in the United States.
The ATP, a cornerstone of Pew Research Center’s data collection efforts, is a continuously updated, nationally representative panel of U.S. adults. Its design prioritizes accuracy and inclusivity, employing advanced sampling techniques and a multi-stage weighting process to ensure that findings reflect the diverse demographics of the American population. The panel’s recruitment and maintenance protocols have evolved over the years, adapting to technological advancements and best practices in survey research.
Overview of the Survey and Panel
Wave 189 of the ATP represents a significant undertaking in public opinion research. The survey period, spanning a week in March 2026, allowed for a comprehensive data collection effort. The overall response rate of 87% is a testament to the effectiveness of the panel’s engagement strategies and the incentives provided to participants. This high response rate minimizes the potential for nonresponse bias, a critical concern in survey research.
Beyond the immediate survey response rate, the cumulative response rate, which accounts for initial recruitment and ongoing panel attrition, stands at 3%. While this figure may appear low, it reflects the stringent criteria for maintaining a high-quality, representative panel over time, where participation in multiple waves and recruitment efforts are factored in. The break-off rate, a measure of panelists who start but do not complete the survey, was a mere 1%, indicating a high level of engagement with the survey instrument itself.

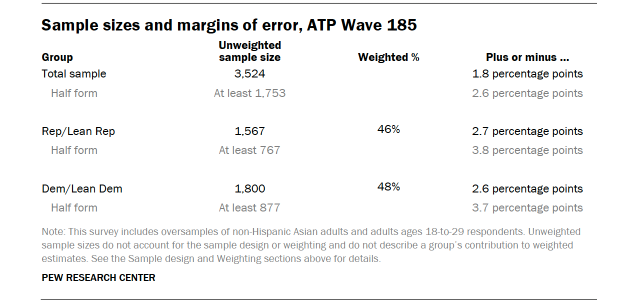
A key feature of the ATP’s methodology is the strategic use of oversampling for specific demographic groups. In Wave 189, non-Hispanic Asian adults were oversampled to ensure sufficient data for precise estimates of their opinions and experiences. This practice is vital for understanding the perspectives of smaller, yet significant, segments of the population. It is important to note that these oversampled groups are statistically weighted back to their correct proportions in the general population during analysis, ensuring that the overall findings remain representative of the U.S. adult population as a whole.
The survey was administered through a dual-mode approach, combining online interviews (n=3,383) with live telephone interviews (n=141), conducted by SSRS on behalf of Pew Research Center. This blended methodology is designed to maximize reach and accommodate different respondent preferences and access to technology. Interviews were available in both English and Spanish, further enhancing the inclusivity of the survey. For those seeking more in-depth information about the ATP’s operational framework, Pew Research Center provides extensive resources on its website.
Panel Recruitment: A Foundation of Representativeness
The recruitment strategy for the American Trends Panel has undergone significant evolution since its inception. Since 2018, the panel has primarily utilized address-based sampling (ABS) for recruitment. This method involves mailing study cover letters and pre-incentives to a stratified, random sample of households selected from the U.S. Postal Service’s Computerized Delivery Sequence File. This file is known to cover a substantial majority of U.S. households, estimated at 90% to 98%, providing a strong foundation for national representativeness. Within each selected household, the adult with the next birthday is identified as the prospective participant, a standard method for ensuring random selection within a household.
While the core ABS protocol has remained consistent, specific details of the recruitment process have been refined over time and are available upon request. Prior to 2018, the ATP relied on traditional landline and cellphone random-digit-dial surveys for recruitment, administered in both English and Spanish. This shift to ABS reflects an adaptation to changing communication patterns and an effort to capture a broader spectrum of the U.S. adult population.
The ATP has a history of proactive recruitment to maintain and expand its panel. Approximately once a year since 2014, a national sample of U.S. adults has been recruited. Recognizing the importance of diverse perspectives, the Center has often implemented additional recruitment efforts, known as oversamples, to bolster representation of specific demographic groups. For instance, Hispanic adults were oversampled in 2019, Black adults in 2022, and Asian adults in 2023, demonstrating a consistent commitment to capturing the views of all segments of American society.
Sample Design: Precision and Proportionality
The sample design for Wave 189 was meticulously crafted to ensure it accurately represented the target population: noninstitutionalized persons aged 18 and older residing in the United States. The survey employed a stratified random sample drawn from the existing ATP panel. A critical element of this design was the selection of non-Hispanic Asian adults with certainty, a direct consequence of the oversampling strategy implemented for this group.
For the remaining panelists, sampling rates were carefully calibrated. The objective was to ensure that the proportion of respondents within each stratum of the sample closely mirrored their proportion in the overall U.S. adult population. This proportionality is crucial for generating unbiased estimates. Any deviations from perfect proportionality due to the sampling process are systematically addressed through the weighting procedures, as detailed in a subsequent section.
Questionnaire Development and Testing: Ensuring Clarity and Accuracy
The development of the survey questionnaire is a collaborative and iterative process. For Wave 189, the questionnaire was jointly developed by Pew Research Center researchers and SSRS, the survey firm responsible for data collection. This partnership ensures that the questions are not only relevant to the research objectives but also formulated with clarity, neutrality, and survey best practices in mind.
Rigorous testing is an integral part of the questionnaire development process. The online survey instrument underwent extensive testing by both the SSRS project team and Pew Research Center researchers. This testing encompassed a wide range of devices, including personal computers and mobile phones, to guarantee a seamless and consistent user experience for all online respondents. Furthermore, the SSRS team populated test data that was meticulously analyzed using SPSS. This step was crucial for verifying the integrity of the survey logic and randomizations, ensuring that the survey functioned as intended before its official launch.
Incentives: Encouraging Participation and Equity
To acknowledge the valuable time and effort contributed by panelists, all respondents were offered a post-paid incentive for their participation in Wave 189. This incentive could be received in the form of a check or a digital gift code, redeemable at major online retailers such as Amazon.com, Target.com, or Walmart.com. The incentive amounts varied, ranging from $5 to $15. This differential incentive structure was intentionally designed to increase participation rates among groups that have historically shown lower survey response propensities. By offering higher incentives to harder-to-reach populations, the ATP aims to achieve a more equitable and representative panel.
Data Collection Protocol: A Multi-Channel Approach
The data collection for Wave 189 took place over a defined field period, from March 16 to March 22, 2026. The survey was administered through two primary channels: self-administered web surveys and live telephone interviews.
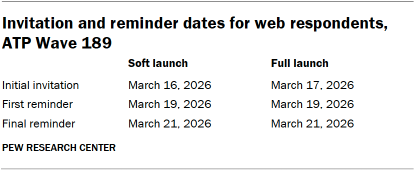
For panelists opting for the online survey, a multi-stage invitation and reminder process was employed. Postcard notifications were mailed to a subset of panelists on March 16 to initiate the process. The survey invitations were then deployed in two distinct launches. A soft launch, beginning with an initial invitation sent on March 16, included sixty panelists. This allowed for a final check of the system and survey flow before a broader rollout. The full launch commenced on March 17, sending invitations to all remaining English- and Spanish-speaking sampled online panelists. Panelists participating online received an email invitation and up to two email reminders if they did not initially respond. For those who had consented to receive SMS messages, an SMS invitation with a direct link to the survey was sent, followed by up to two SMS reminders.
The telephone data collection followed a similar phased approach. Prenotification postcards were mailed on March 13 to inform sampled panelists about the upcoming survey. A soft launch for telephone interviews began on March 16, with interviewers dialing numbers until nine completed interviews were secured. This initial phase allowed for quality control of the interviewer scripts and protocols. Subsequently, the telephone numbers of all remaining English- and Spanish-speaking sampled phone panelists were dialed throughout the remainder of the field period. Panelists contacted via telephone could receive up to six calls from trained SSRS interviewers, a standard practice to maximize the chances of reaching a respondent.
Data Quality Checks: Upholding Integrity
Maintaining the integrity of the data is paramount for Pew Research Center. Throughout the data collection and processing stages, rigorous data quality checks were implemented. These checks are designed to identify any respondents exhibiting patterns of satisficing, a behavior where respondents provide superficial or non-attentive answers to survey questions. Indicators of satisficing include leaving a disproportionately high number of questions blank or consistently selecting the first or last option presented in a list of choices. Based on these checks, eight ATP respondents were identified and subsequently removed from the survey dataset prior to the weighting and analysis phases, ensuring that the final results are based on the most engaged and thoughtful responses.
Weighting: The Key to Representativeness
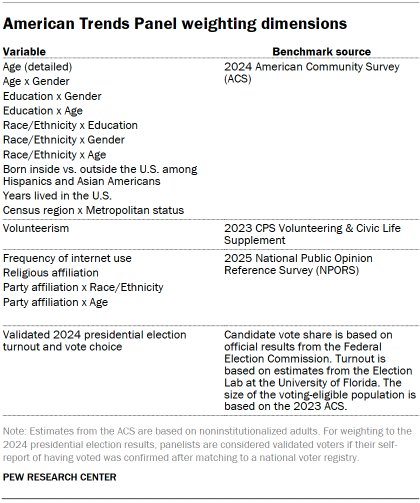
The weighting process for the ATP data is a sophisticated, multi-stage procedure designed to correct for various sources of potential bias that can arise throughout the panel survey lifecycle. Each panelist begins with a base weight that reflects their initial probability of being recruited into the panel. These base weights are then calibrated to align with established population benchmarks. This calibration process addresses nonresponse that may occur during the initial recruitment surveys and also accounts for panel attrition, where panelists may become less active or leave the panel over time.
In instances where only a subsample of the panel is invited to participate in a particular wave, the weights are further adjusted to account for any differential probabilities of selection among those invited. This ensures that even if not all panelists are surveyed, the sample remains representative.
For panelists who successfully complete the survey, the weights are again calibrated. This second calibration aligns the data with population benchmarks specific to the current wave’s respondents. To mitigate the impact of extreme weights on the precision of estimates, weights are trimmed at the 1st and 99th percentiles. This trimming process reduces the variance in weights, thereby improving the efficiency of the estimates. Crucially, the statistical analysis of the data, including the calculation of sampling errors and tests of statistical significance, takes into account the complex effects of this multi-stage weighting procedure.
The accompanying tables provide critical information regarding the weighting dimensions, including the unweighted sample sizes and the expected sampling errors for various demographic groups at a 95% confidence level. These figures are essential for researchers and the public to understand the precision of the estimates derived from the survey. While sampling error is a key consideration, it is also important to acknowledge that other factors, such as question wording and the practical challenges inherent in conducting surveys, can introduce non-sampling error or bias into the findings.
Dispositions and Response Rates: A Comprehensive View
Detailed disposition tables provide a transparent breakdown of how the initial sample of panelists was processed throughout the data collection period for Wave 189. These tables categorize panelists by their final status, including completed interviews, refusals, and non-contact statuses. This granular data is vital for calculating various response rates and understanding the flow of participants through the survey process.
The cumulative response rate, a key metric for assessing the overall success of the panel’s engagement over time, is also presented. This metric offers a holistic view of the panel’s ability to maintain a representative and engaged membership across multiple survey waves and recruitment cycles. Understanding these rates is fundamental to evaluating the reliability and generalizability of the survey findings.


