

The latest findings from Pew Research Center’s American Trends Panel (ATP) provide a comprehensive look at the methodologies employed in Wave 192 of their nationally representative survey. Conducted between April 20 and April 26, 2026, this significant undertaking involved 5,103 respondents out of an initial sample of 5,898 individuals, yielding a robust survey-level response rate of 87%. The ATP, a cornerstone of Pew Research Center’s data collection efforts, is designed to capture the opinions and experiences of a diverse range of U.S. adults, employing rigorous standards to ensure the reliability and validity of its findings.
This detailed examination of the survey methodology underscores Pew Research Center’s commitment to transparency and methodological excellence. The cumulative response rate, which accounts for initial recruitment nonresponse and subsequent panel attrition, stands at 3%. Furthermore, the break-off rate among panelists who began the survey but did not complete it was a mere 1%, indicating a high level of engagement from participants. The margin of sampling error for the full sample of 5,103 respondents is calculated at plus or minus 1.6 percentage points at a 95% confidence level, a standard measure of the precision of survey results.
A key feature of the ATP’s methodology, particularly in Wave 192, was the strategic use of oversamples. To ensure more precise estimates for smaller demographic subgroups, the survey intentionally included larger-than-proportionate numbers of non-Hispanic Asian adults and Hispanic validated Trump voters. This technique is crucial for understanding the nuances of public opinion within these specific communities, which might otherwise be statistically obscured in a general population sample. It is important to note that these oversampled groups are subsequently weighted back to their correct proportions within the overall U.S. adult population to maintain the generalizability of the findings. This approach balances the need for detailed subgroup analysis with the imperative of accurate representation of the national demographic landscape.
The survey itself was administered by SSRS, a respected survey research firm, utilizing a dual-channel approach: 4,900 respondents completed the survey online, while 203 participated via live telephone interviews. The survey was made available in both English and Spanish, further enhancing its accessibility and inclusivity. For those interested in the broader context of the ATP’s operations and history, Pew Research Center offers extensive resources, including a dedicated section on their website detailing the panel’s establishment and evolution.

Panel Recruitment: A Foundation of Robust Sampling
The recruitment strategy for the American Trends Panel has evolved significantly since its inception. Since 2018, the ATP has predominantly relied on Address-Based Sampling (ABS) for recruiting new panelists. This method involves mailing study cover letters and pre-incentives to a stratified, random sample of households selected from the U.S. Postal Service’s Computerized Delivery Sequence File. This file is estimated to cover a substantial 90% to 98% of the U.S. population, providing a broad and representative base for recruitment. Within each selected household, the adult whose birthday is next is identified as the potential participant. While the specific protocols for ABS recruitment have been refined over time, details are available upon request. Prior to 2018, the ATP’s recruitment was primarily conducted through landline and cellphone random-digit-dial surveys, also administered in English and Spanish.
The ATP has undertaken national recruitment efforts approximately once a year since 2014. In several of these recruitment cycles, additional efforts, known as oversamples, have been implemented to bolster the accuracy of data for underrepresented groups. For instance, Hispanic adults were oversampled in 2019, Black adults in 2022, and Asian adults in 2023. These targeted recruitment drives are vital for ensuring that the panel composition remains representative of the U.S. population and allows for robust analysis of diverse communities.
Sample Design: Precision Through Stratification and Oversampling
The target population for this particular survey (Wave 192) encompassed noninstitutionalized individuals aged 18 and older residing in the United States. The sample design for this wave featured a stratified random sample drawn from the existing ATP panel. As mentioned previously, specific groups were oversampled: non-Hispanic Asian adults and Hispanic validated Trump voters. The remaining panelists were selected at rates intended to maintain proportionality to their representation in the broader U.S. adult population, to the maximum extent feasible. The subsequent adjustment of respondent weights is a critical step in accounting for the differential probabilities of selection inherent in such a sampling design.
Questionnaire Development and Testing: Ensuring Accuracy and Usability
The questionnaire for Wave 192 was meticulously developed by Pew Research Center in collaboration with SSRS. This consultative process ensures that the questions are clear, unbiased, and effectively designed to elicit accurate responses. The online survey platform underwent rigorous testing by both the SSRS project team and Pew Research Center researchers. This testing spanned various devices, including PCs and mobile phones, to guarantee a seamless and functional user experience for all online respondents. Furthermore, the SSRS team populated test data that was analyzed using SPSS to confirm the survey’s logic and randomizations were functioning as intended before the official launch. This thorough pre-launch preparation is a hallmark of high-quality survey research, minimizing potential technical issues that could affect data integrity.
Incentives: Encouraging Participation and Recognizing Value
To foster participation and acknowledge the valuable time and insights of its panelists, all respondents in Wave 192 were offered a post-paid incentive. Participants had the flexibility to choose their incentive in the form of a check or a digital gift code redeemable at major online retailers such as Amazon.com, Target.com, or Walmart.com. The value of these incentives ranged from $5 to $15, with the amount determined by how difficult or easy it was to reach specific demographic groups. This differential incentive strategy is deliberately employed to enhance panel survey participation among populations that traditionally exhibit lower survey response propensities, thereby contributing to a more representative sample.
Data Collection Protocol: A Structured and Phased Approach
The data collection for Wave 192 was conducted over a seven-day period, from April 20 to April 26, 2026. The survey was administered through two primary methods: self-administered web surveys and live telephone interviews.
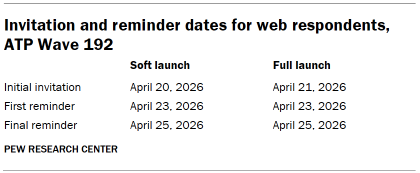
For panelists opting for the online survey, a phased invitation process was implemented. Postcard notifications were mailed to a select group of panelists on April 20, initiating the process. The survey invitations were then sent out in two distinct launches. A "soft launch" involved 60 panelists and began with an initial invitation on April 20. Following this initial phase, the "full launch" commenced on April 21, sending invitations to all remaining English- and Spanish-speaking sampled online panelists.
Panelists participating online received an email invitation. For those who did not respond to the initial invitation, up to two email reminders were sent. Panelists who had previously consented to receive SMS messages were also sent an SMS invitation containing a direct link to the survey, followed by up to two SMS reminders if necessary. This multi-channel communication strategy aims to maximize response rates and ensure that all invited panelists have ample opportunity to participate.
For panelists who preferred or were directed to live telephone interviews, a similar structured approach was employed. Prenotification postcards were mailed to this group on April 17. A soft launch for telephone interviews began on April 20, with interviewers dialing numbers until a total of five completed interviews were achieved. Subsequently, throughout the remainder of the field period, numbers of all remaining English- and Spanish-speaking sampled phone panelists were dialed. Trained SSRS interviewers could make up to six calls to contact panelists for telephone surveys, further demonstrating the effort invested in securing participation.
Data Quality Checks: Safeguarding Against Unsatisfactory Responses
Pew Research Center places a high priority on data quality. Throughout the analysis phase, Center researchers conducted rigorous data quality checks to identify any respondents exhibiting patterns of "satisficing." This involves looking for behaviors such as leaving an unusually high number of questions blank or consistently selecting the first or last option presented in a list. As a result of these meticulous checks, three ATP respondents were identified and subsequently removed from the survey dataset prior to the weighting and analysis stages. This proactive measure ensures that the final dataset is as free as possible from the potential biases introduced by disengaged respondents.
Weighting: Achieving Representativeness Through Statistical Adjustment
The weighting process for the ATP data is a sophisticated, multi-stage procedure designed to correct for various sources of nonresponse and differential probabilities of selection that occur throughout the panel survey lifecycle. Initially, each panelist is assigned a base weight that reflects their likelihood of being recruited into the panel. These base weights are then calibrated against population benchmarks to compensate for nonresponse during the recruitment surveys and for panel attrition over time. If a specific wave of the survey involves inviting only a subset of the panelists, the weights are further adjusted to account for any differential selection probabilities within that subset.
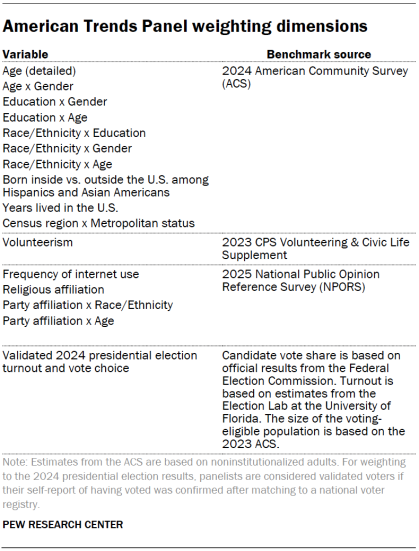
Following the completion of the survey, the weights for respondents who finished the questionnaire are again calibrated. This second calibration aligns the weighted data with population benchmarks, as detailed in an accompanying table. To mitigate the potential loss of statistical precision that can arise from extreme weight values, weights are trimmed at the 1st and 99th percentiles. This ensures that the influence of any outlier weights is minimized. Crucially, the sampling errors and statistical significance tests conducted on the data take into account the impact of this weighting procedure.
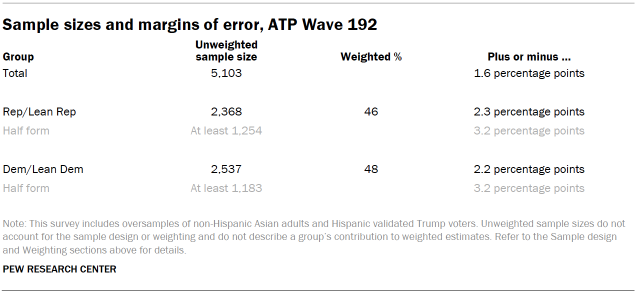
The accompanying table presents the unweighted sample sizes for various groups within the survey, along with the expected sampling error at a 95% confidence level. These figures provide researchers and the public with a clear understanding of the precision of estimates for different demographic and attitudinal segments of the population. For instance, the overall sample of 5,103 respondents has a margin of error of ±1.6 percentage points. Margins of error for specific subgroups, which are often larger due to smaller sample sizes, are available upon request.
It is important to acknowledge that in addition to sampling error, other factors such as question wording and practical challenges encountered during survey administration can introduce potential error or bias into opinion poll findings. Pew Research Center’s commitment to methodological transparency ensures that users are aware of these limitations and can interpret the findings accordingly.
Dispositions and Response Rates: A Detailed Account of Participation
The detailed breakdown of dispositions and response rates in Wave 192 offers a transparent view of the survey’s operational outcomes. These figures are essential for evaluating the completeness and representativeness of the collected data. The comprehensive tables provide clarity on the number of individuals contacted, their response status (e.g., completed, refused, not reachable), and the calculation of various response rates, including the crucial cumulative response rate. This level of detail allows for a thorough assessment of the survey’s methodological rigor and the reliability of its findings. The inclusion of these detailed metrics reinforces the commitment to transparent and accountable survey research practices.


